数据分析与机器学习五:matplotlib--boxplot盒图
盒图:
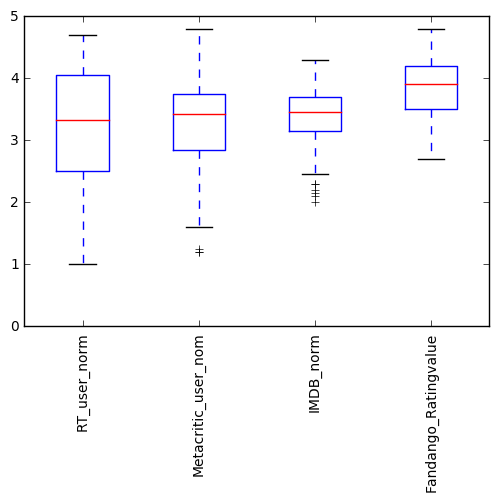
定义盒图(四分图):ax.boxplot(数据列表)
设置x轴的标签:ax.set_xticklables(标签列表,rotation=标签的倾斜度)
设置y轴的刻度范围:ax.set_ylim(起始值,终止值)
num_cols = ['RT_user_norm', 'Metacritic_user_nom', 'IMDB_norm', 'Fandango_Ratingvalue']
fig, ax = plt.subplots()
ax.boxplot(norm_reviews[num_cols].values)
ax.set_xticklabels(num_cols, rotation=90)
ax.set_ylim(0,5)
plt.show()
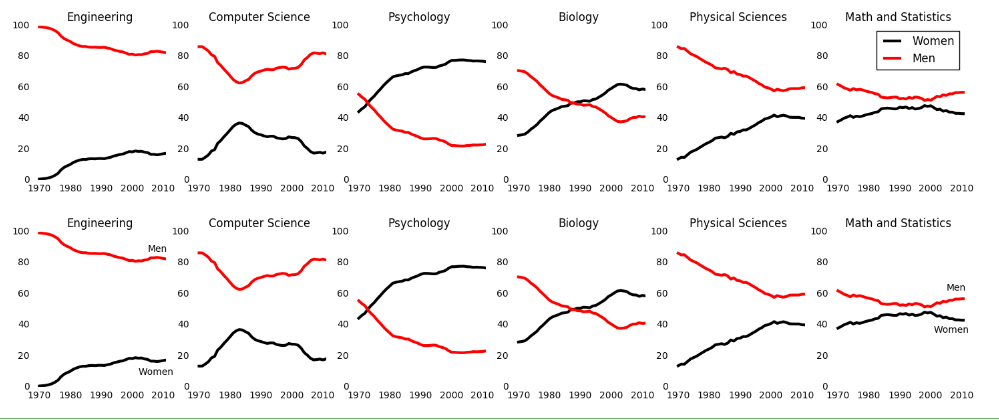
折线图示例:
fig = plt.figure(figsize=(18, 3))

for sp in range(0,6):
    ax = fig.add_subplot(1,6,sp+1)
    ax.plot(women_degrees['Year'], women_degrees[stem_cats[sp]], c=cb_dark_blue, label='Women', linewidth=3)
    ax.plot(women_degrees['Year'], 100-women_degrees[stem_cats[sp]], c=cb_orange, label='Men', linewidth=3)
    for key,spine in ax.spines.items():
        spine.set_visible(False)
    ax.set_xlim(1968, 2011)
    ax.set_ylim(0,100)
    ax.set_title(stem_cats[sp])
    ax.tick_params(bottom="off", top="off", left="off", right="off")
plt.legend(loc='upper right')
plt.show()

fig = plt.figure(figsize=(18, 3))

for sp in range(0,6):
    ax = fig.add_subplot(1,6,sp+1)
    ax.plot(women_degrees['Year'], women_degrees[stem_cats[sp]], c=cb_dark_blue, label='Women', linewidth=3)
    ax.plot(women_degrees['Year'], 100-women_degrees[stem_cats[sp]], c=cb_orange, label='Men', linewidth=3)
    for key,spine in ax.spines.items():
        spine.set_visible(False)
    ax.set_xlim(1968, 2011)
    ax.set_ylim(0,100)
    ax.set_title(stem_cats[sp])
    ax.tick_params(bottom="off", top="off", left="off", right="off")

    if sp == 0:
        ax.text(2005, 87, 'Men')  # ax.text(x位置,y位置,标注的文字)
        ax.text(2002, 8, 'Women')
    elif sp == 5:
        ax.text(2005, 62, 'Men')
        ax.text(2001, 35, 'Women')
plt.show()
posted on 2018-10-02 12:24 myworldworld 阅读(731) 评论(0) 收藏 举报


 浙公网安备 33010602011771号