

数据格式
名字 位移 四元数
DJI_0004.JPG -2.37741281 -6.19963198 248.278836 0.998595199 -0.0512734054 0.0117946896 -0.00628908729
DJI_0010.JPG -2.45427362 -5.88529261 292.870321 0.999918745 -0.00109888998 0.011512375 -0.00536295244
DJI_0011.JPG -1.43944546 -7.71958098 292.438011 0.99944091 -0.030903986 0.00953700235 -0.00847682591
DJI_0012.JPG -1.98761639 -7.61452423 296.857543 0.999072811 -0.0410232501 0.0102957152 -0.00803797691
DJI_0013.JPG -1.92906222 -8.09665682 305.51838 0.999054902 -0.0414503943 0.00999650388 -0.00844022832
DJI_0014.JPG -2.07826083 -7.57746179 304.540909 0.999041713 -0.0418568415 0.00989608494 -0.0081073026
DJI_0015.JPG -1.96854472 -7.47198092 302.289007 0.99890921 -0.0450732506 0.00924253877 -0.00796044695
DJI_0016.JPG -2.03264579 -7.58901779 299.285379 0.999004689 -0.0428638059 0.00927430802 -0.00814332051
DJI_0017.JPG -1.93430134 -7.46199335 298.6258 0.999221874 -0.0374756479 0.00936322992 -0.00797201434
import os
from typing import Dict, Tuple
import matplotlib.pyplot as plt
from mpl_toolkits.mplot3d import Axes3D
import numpy as np
from scipy.spatial.transform import Rotation as R
def read_slam_data(file_path: str) -> Dict[str, Tuple[list, list]]:
"""
从SLAM数据文件中读取数据并构建字典
"""
slam_data = {}
try:
with open(file_path, 'r', encoding='utf-8') as file:
for line_num, line in enumerate(file, 1):
line = line.strip()
if not line:
continue
parts = line.split()
if len(parts) < 8:
print(f"警告: 第{line_num}行数据格式不正确,跳过: {line}")
continue
try:
photo_name = parts[0]
t_displacement = [float(x) for x in parts[1:4]]
q_quaternion = [float(x) for x in parts[4:8]]
slam_data[photo_name] = (t_displacement, q_quaternion)
except ValueError as e:
print(f"错误: 第{line_num}行数据转换失败: {line}")
continue
except FileNotFoundError:
print(f"错误: 文件 {file_path} 不存在")
return {}
except Exception as e:
print(f"错误: 读取文件时发生异常: {e}")
return {}
return slam_data
def get_camera_orientation_vectors(q_w, q_x, q_y, q_z, vector_scale=1.0):
"""
获取相机的三个方向向量(前向、右向、上向)
Returns:
forward_vector: 前向向量 (Z轴)
right_vector: 右向向量 (X轴)
up_vector: 上向向量 (Y轴)
"""
# 将四元数转换为旋转矩阵[2,3](@ref)
rotation = R.from_quat([q_x, q_y, q_z, q_w])
rot_mat = rotation.as_matrix()
# 相机坐标系标准方向[4](@ref)
forward_vector = rot_mat[:, 2] * vector_scale # Z轴前向
right_vector = rot_mat[:, 0] * vector_scale # X轴右向
up_vector = rot_mat[:, 1] * vector_scale # Y轴上向
return forward_vector, right_vector, up_vector
def quaternion_to_euler(q_w, q_x, q_y, q_z):
"""
将四元数转换为欧拉角(Pitch, Yaw, Roll)[2](@ref)
"""
rotation = R.from_quat([q_x, q_y, q_z, q_w])
euler_angles = rotation.as_euler('zyx', degrees=True)
return euler_angles[1], euler_angles[0], euler_angles[2]
def calculate_adaptive_vector_scale(positions, base_scale=0.5):
"""
根据轨迹范围自适应计算向量缩放比例
"""
x_range = positions[:, 0].max() - positions[:, 0].min()
y_range = positions[:, 1].max() - positions[:, 1].min()
z_range = positions[:, 2].max() - positions[:, 2].min()
avg_range = (x_range + y_range + z_range) / 3.0
if avg_range == 0:
return base_scale
# 根据轨迹范围调整向量大小
adaptive_scale = base_scale * (avg_range / 3.0)
return max(0.3, min(2.0, adaptive_scale)) # 限制在合理范围内
def visualize_trajectory_with_3d_vectors(poses_dict, stride=3, vector_scale_factor=0.8):
"""
完整的SLAM轨迹可视化:3D轨迹 + 三个带3D向量的侧视图
"""
# 创建2x2的子图布局
fig = plt.figure(figsize=(18, 14))
# 主3D视图
ax_3d = fig.add_subplot(221, projection='3d')
# 三个侧视图
ax_xy = fig.add_subplot(222) # XY平面视图
ax_xz = fig.add_subplot(223) # XZ平面视图
ax_yz = fig.add_subplot(224) # YZ平面视图
# 提取所有位姿数据
positions = np.array([pose[0] for pose in poses_dict.values()])
# 自适应计算向量缩放比例
adaptive_vector_scale = calculate_adaptive_vector_scale(positions, vector_scale_factor)
print(f"自适应向量缩放比例: {adaptive_vector_scale:.3f}")
# 1. 绘制3D主视图
plot_3d_main_view(ax_3d, positions, poses_dict, stride, adaptive_vector_scale)
# 2. 绘制三个带3D向量的侧视图
plot_2d_views_with_3d_vectors(ax_xy, ax_xz, ax_yz, positions, poses_dict,
stride, adaptive_vector_scale)
plt.tight_layout()
plt.show()
def plot_3d_main_view(ax, positions, poses_dict, stride, vector_scale):
"""
绘制3D主视图,包含轨迹、三个方向的向量和欧拉角显示
"""
# 绘制轨迹线
ax.plot(positions[:, 0], positions[:, 1], positions[:, 2], 'b-',
alpha=0.7, linewidth=2, label='Trajectory')
# 轨迹点(颜色表示序列)
scatter = ax.scatter(positions[:, 0], positions[:, 1], positions[:, 2],
c=range(len(positions)), cmap='viridis', s=20, alpha=0.6)
# 添加颜色条
cbar = plt.colorbar(scatter, ax=ax, pad=0.1)
cbar.set_label('Frame Sequence')
# 存储向量的标签,避免重复
forward_label_added = False
right_label_added = False
up_label_added = False
euler_label_added = False
# 绘制三个方向的向量(前向、右向、上向)
for i, (photo_name, (t, q)) in enumerate(poses_dict.items()):
if i % stride == 0:
# 获取三个方向向量
forward_vec, right_vec, up_vec = get_camera_orientation_vectors(
q[0], q[1], q[2], q[3], vector_scale)
# 计算欧拉角
pitch, yaw, roll = quaternion_to_euler(q[0], q[1], q[2], q[3])
# 绘制前向向量(Z轴,蓝色)
if not forward_label_added:
ax.quiver(t[0], t[1], t[2],
forward_vec[0], forward_vec[1], forward_vec[2],
color='blue', alpha=0.8, linewidth=2, label=f'Forward (Z)\nPitch: {pitch:.1f}°')
forward_label_added = True
else:
ax.quiver(t[0], t[1], t[2],
forward_vec[0], forward_vec[1], forward_vec[2],
color='blue', alpha=0.8, linewidth=2)
# 绘制右向向量(X轴,红色)
if not right_label_added:
ax.quiver(t[0], t[1], t[2],
right_vec[0], right_vec[1], right_vec[2],
color='red', alpha=0.8, linewidth=2, label=f'Right (X)\nRoll: {roll:.1f}°')
right_label_added = True
else:
ax.quiver(t[0], t[1], t[2],
right_vec[0], right_vec[1], right_vec[2],
color='red', alpha=0.8, linewidth=2)
# 绘制上向向量(Y轴,绿色)
if not up_label_added:
ax.quiver(t[0], t[1], t[2],
up_vec[0], up_vec[1], up_vec[2],
color='green', alpha=0.8, linewidth=2, label=f'Up (Y)\nYaw: {yaw:.1f}°')
up_label_added = True
else:
ax.quiver(t[0], t[1], t[2],
up_vec[0], up_vec[1], up_vec[2],
color='green', alpha=0.8, linewidth=2)
# 在关键帧位置添加欧拉角文本标签
if i % (stride * 5) == 0: # 每隔5个向量添加一次角度文本
angle_text = f'P:{pitch:.0f}°\nY:{yaw:.0f}°\nR:{roll:.0f}°'
ax.text(t[0], t[1], t[2], angle_text,
fontsize=8, color='black', alpha=0.7,
bbox=dict(boxstyle="round,pad=0.2", facecolor='white', alpha=0.5))
ax.set_xlabel('X (m)')
ax.set_ylabel('Y (m)')
ax.set_zlabel('Z (m)')
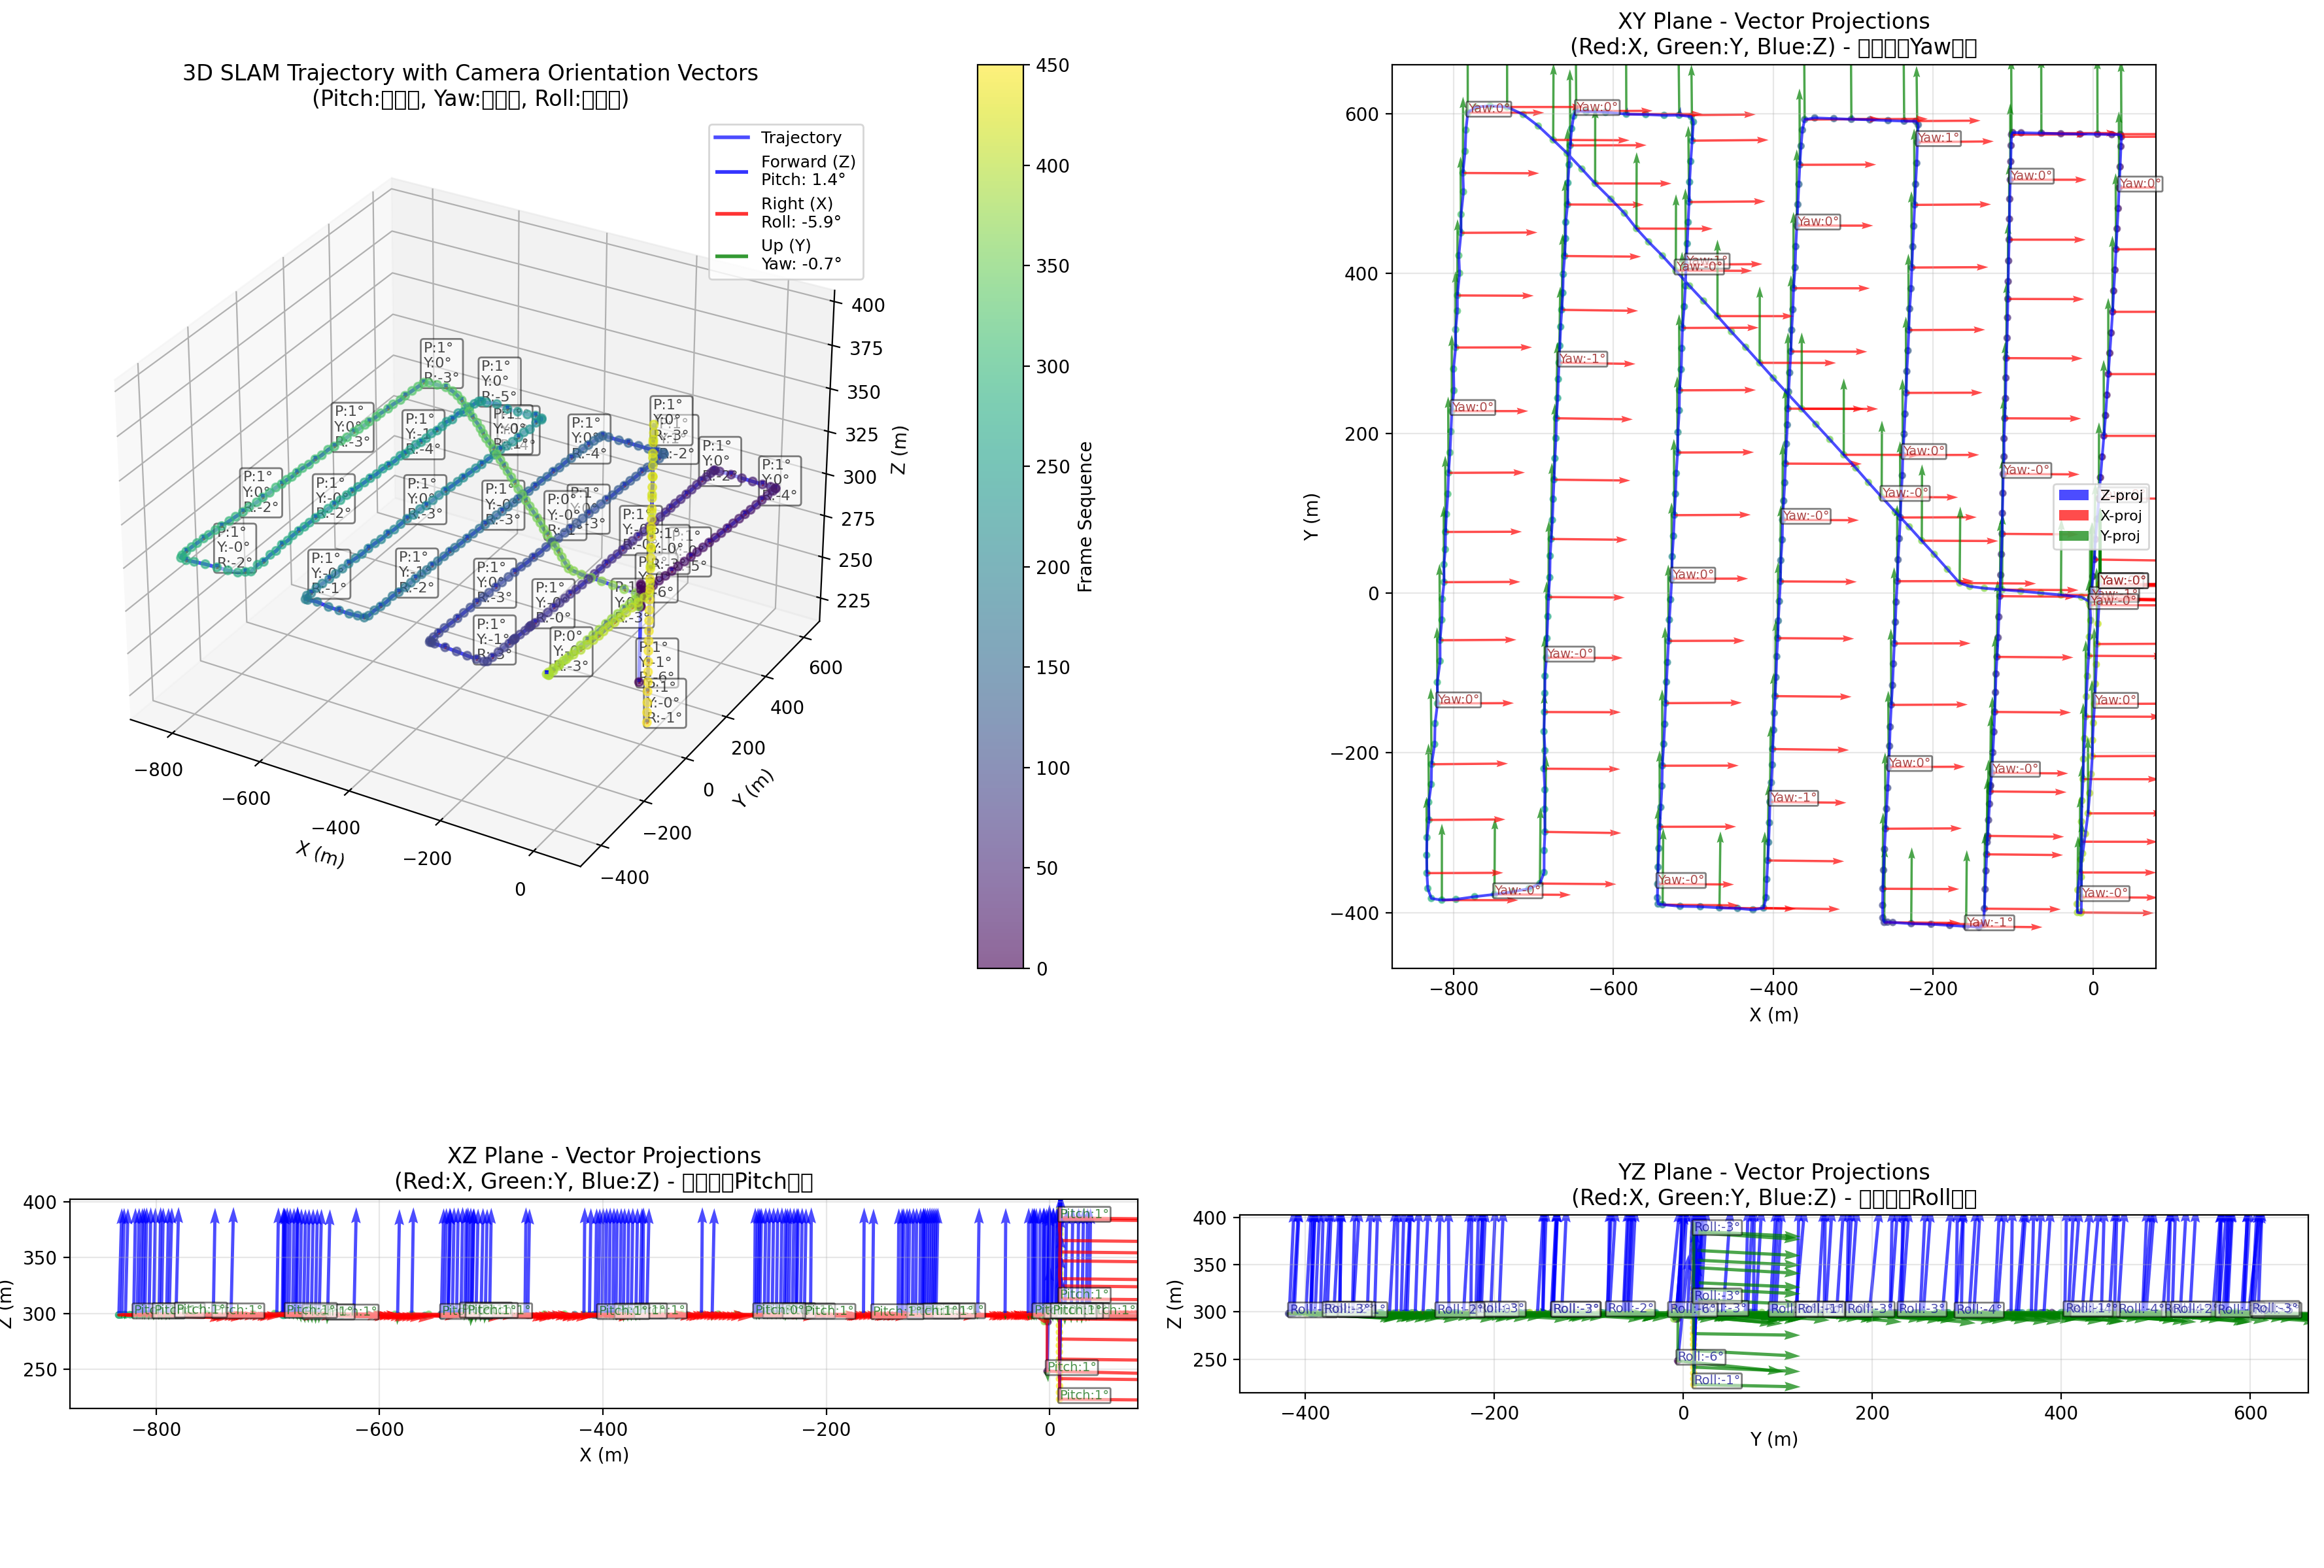
ax.set_title('3D SLAM Trajectory with Camera Orientation Vectors\n(Pitch:俯仰角, Yaw:偏航角, Roll:翻滚角)')
ax.legend(loc='upper right', fontsize=9)
ax.grid(True, alpha=0.3)
# 修改侧视图函数,也添加角度信息
def plot_2d_views_with_3d_vectors(ax_xy, ax_xz, ax_yz, positions, poses_dict, stride, vector_scale):
"""
绘制三个带3D向量投影的侧视图,包含角度信息
"""
# 设置颜色映射
colors = ['red', 'green', 'blue'] # X, Y, Z轴颜色
# XY平面视图(俯视图)
ax_xy.plot(positions[:, 0], positions[:, 1], 'b-', alpha=0.7, linewidth=1.5)
scatter_xy = ax_xy.scatter(positions[:, 0], positions[:, 1], c=range(len(positions)),
cmap='viridis', s=10, alpha=0.6)
# XZ平面视图(前视图)
ax_xz.plot(positions[:, 0], positions[:, 2], 'r-', alpha=0.7, linewidth=1.5)
ax_xz.scatter(positions[:, 0], positions[:, 2], c=range(len(positions)),
cmap='viridis', s=10, alpha=0.6)
# YZ平面视图(侧视图)
ax_yz.plot(positions[:, 1], positions[:, 2], 'g-', alpha=0.7, linewidth=1.5)
ax_yz.scatter(positions[:, 1], positions[:, 2], c=range(len(positions)),
cmap='viridis', s=10, alpha=0.6)
# 在每个侧视图中绘制3D向量的投影
for i, (photo_name, (t, q)) in enumerate(poses_dict.items()):
if i % stride == 0:
# 获取三个方向向量
forward_vec, right_vec, up_vec = get_camera_orientation_vectors(
q[0], q[1], q[2], q[3], vector_scale)
# 计算欧拉角用于显示
pitch, yaw, roll = quaternion_to_euler(q[0], q[1], q[2], q[3])
# 在特定位置显示角度
if i % (stride * 5) == 0:
# XY平面添加角度文本
ax_xy.text(t[0], t[1], f'Yaw:{yaw:.0f}°',
fontsize=7, color='darkred', alpha=0.7,
bbox=dict(boxstyle="round,pad=0.1", facecolor='white', alpha=0.5))
# XZ平面添加角度文本
ax_xz.text(t[0], t[2], f'Pitch:{pitch:.0f}°',
fontsize=7, color='darkgreen', alpha=0.7,
bbox=dict(boxstyle="round,pad=0.1", facecolor='white', alpha=0.5))
# YZ平面添加角度文本
ax_yz.text(t[1], t[2], f'Roll:{roll:.0f}°',
fontsize=7, color='darkblue', alpha=0.7,
bbox=dict(boxstyle="round,pad=0.1", facecolor='white', alpha=0.5))
# XY平面:显示X和Y方向的投影
# 前向向量在XY平面的投影(Z方向)
ax_xy.quiver(t[0], t[1],
forward_vec[0], forward_vec[1],
color=colors[2], alpha=0.7, scale=20, width=0.003,
label='Z-proj' if i == 0 else "")
# 右向向量在XY平面的投影(X方向)
ax_xy.quiver(t[0], t[1],
right_vec[0], right_vec[1],
color=colors[0], alpha=0.7, scale=20, width=0.003,
label='X-proj' if i == 0 else "")
# 上向向量在XY平面的投影(Y方向)
ax_xy.quiver(t[0], t[1],
up_vec[0], up_vec[1],
color=colors[1], alpha=0.7, scale=20, width=0.003,
label='Y-proj' if i == 0 else "")
# XZ平面:显示X和Z方向的投影
ax_xz.quiver(t[0], t[2],
forward_vec[0], forward_vec[2],
color=colors[2], alpha=0.7, scale=20, width=0.003)
ax_xz.quiver(t[0], t[2],
right_vec[0], right_vec[2],
color=colors[0], alpha=0.7, scale=20, width=0.003)
ax_xz.quiver(t[0], t[2],
up_vec[0], up_vec[2],
color=colors[1], alpha=0.7, scale=20, width=0.003)
# YZ平面:显示Y和Z方向的投影
ax_yz.quiver(t[1], t[2],
forward_vec[1], forward_vec[2],
color=colors[2], alpha=0.7, scale=20, width=0.003)
ax_yz.quiver(t[1], t[2],
right_vec[1], right_vec[2],
color=colors[0], alpha=0.7, scale=20, width=0.003)
ax_yz.quiver(t[1], t[2],
up_vec[1], up_vec[2],
color=colors[1], alpha=0.7, scale=20, width=0.003)
# 设置侧视图标签和标题
ax_xy.set_xlabel('X (m)')
ax_xy.set_ylabel('Y (m)')
ax_xy.set_title('XY Plane - Vector Projections\n(Red:X, Green:Y, Blue:Z) - 主要显示Yaw角度')
ax_xy.grid(True, alpha=0.3)
ax_xy.legend(fontsize=8)
ax_xy.set_aspect('equal')
ax_xz.set_xlabel('X (m)')
ax_xz.set_ylabel('Z (m)')
ax_xz.set_title('XZ Plane - Vector Projections\n(Red:X, Green:Y, Blue:Z) - 主要显示Pitch角度')
ax_xz.grid(True, alpha=0.3)
ax_xz.set_aspect('equal')
ax_yz.set_xlabel('Y (m)')
ax_yz.set_ylabel('Z (m)')
ax_yz.set_title('YZ Plane - Vector Projections\n(Red:X, Green:Y, Blue:Z) - 主要显示Roll角度')
ax_yz.grid(True, alpha=0.3)
ax_yz.set_aspect('equal')
# 主程序
if __name__ == "__main__":
data_path = '/media/r9000k/DD_XS/2数据/2RTK/data_1_nwpuUp/data3_1130_13pm/300_map_12pm/slam_out/建图/'
file_path = data_path + "1_2_frame_slam_in_gnss_enu.txt" #1_2_frame_slam_in_gnss_enu 1_1_frame_slam_enu
# 读取数据
slam_data = read_slam_data(file_path)
if not slam_data:
print("未读取到有效数据,程序退出。")
exit()
print(f"成功读取 {len(slam_data)} 条SLAM数据")
print("=" * 60)
#positions = np.array([pose[0] for pose in slam_data.values()])
for photo_name, pose in slam_data.items():
t_displacement, q_quaternion = pose # 直接解包元组
print(f"照片 {photo_name}: 位移 {t_displacement}, 四元数 {q_quaternion}")
stride_val = 3
vector_scale_val = 1.2
# 执行完整可视化
visualize_trajectory_with_3d_vectors(
slam_data,
stride=stride_val,
vector_scale_factor=vector_scale_val
)

 浙公网安备 33010602011771号