

二进制文件可视化(二)
前不久看到了几个二进制文件可视化的项目,做了一些了解,通过可视化可以看出加壳或者加密文件,在纹理结构上和正常文件还是有较大区别。
而且可视化对文件格式不敏感,任何文件都可以查看其可视化结果。
二进制文件可视化
可视化数据源可分为以下两类:
-
二进制文件可视化
-
二进制熵可视化
对绘图的方式有几种方法:
- 传统的一维序列转二维。如固定图像宽度,对序列进行reshape
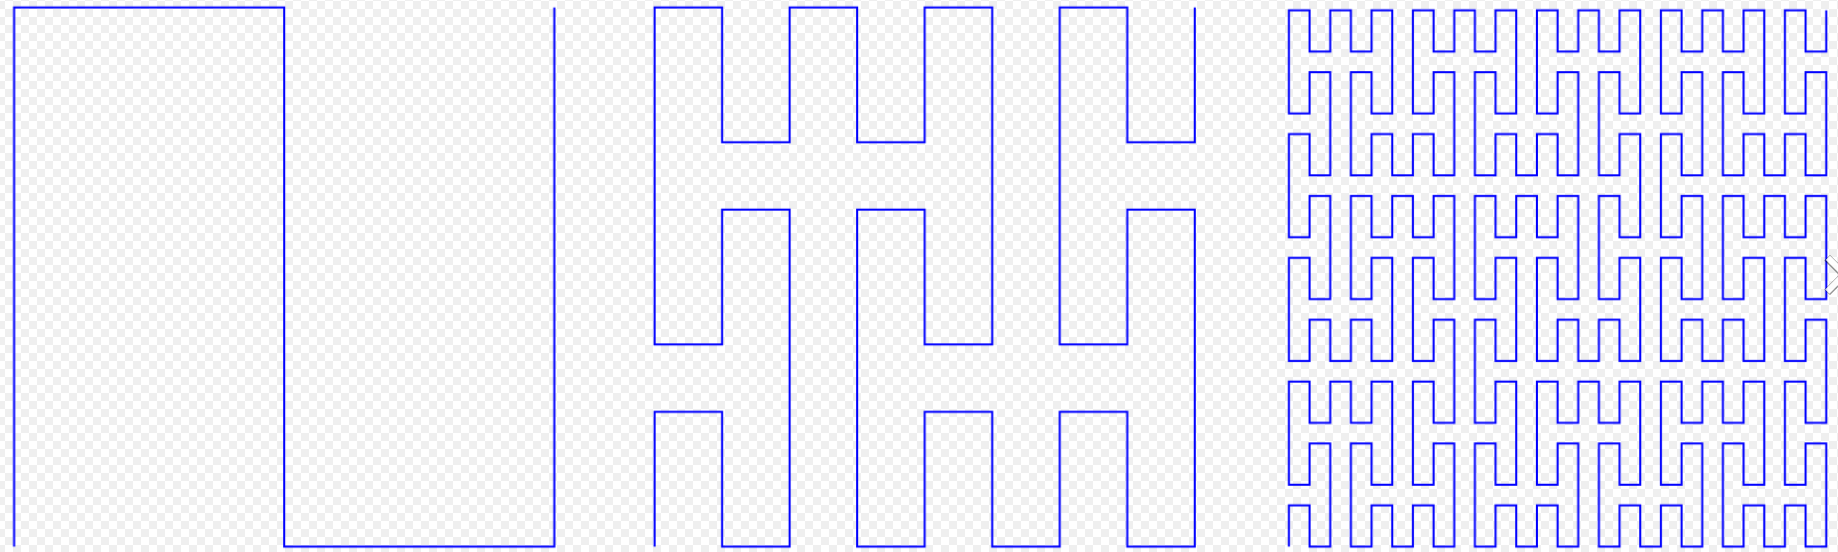
- 使用希尔伯特曲线
这两种方法其实都是空间填充曲线的子类,有兴趣可以了解。
对绘图的色彩也可分为以下
-
灰度图,直接生成就是灰度图
-
彩色图,不同区域设定不同颜色,如portex【1】中的分了以下五种色类
# 分别对应不同的颜色 0xff, 0x00, 可见ASCII码, 不可及ascii码,非ascii码 -
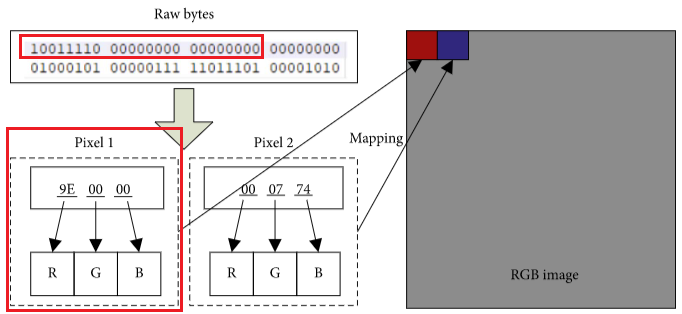
彩色图,直接使用多通道,即每三个连续的字节作为一个通道的值,源自【2】
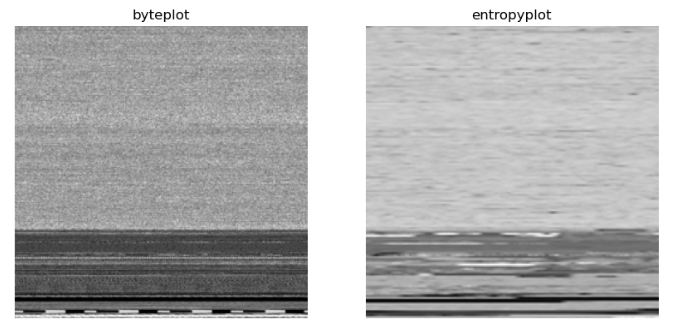
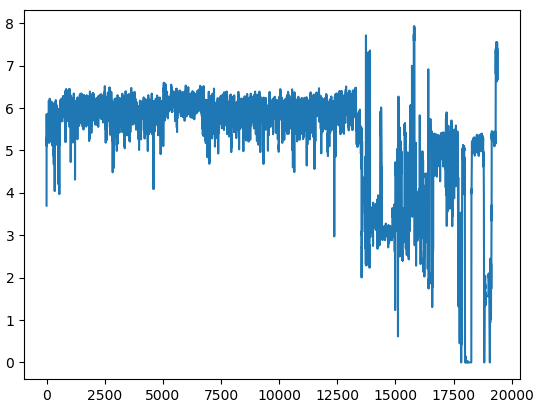
灰度图以及熵
分别将原始二进制文件可视化,熵可视化,这里使用了最简单的可视化方法。
def bin2image(content, resize=True):
    """
    binary to gray image
    """
    width = imagesize(len(content))
    fh = np.frombuffer(content, dtype=np.uint8)
    rn = len(fh)/width
    fh = np.reshape(fh[:int(rn)*width],(int(rn),width))

    im = Image.fromarray(fh)
    if resize:
        im = im.resize((244,244))
    return im

def H(data):
    ''' Calculate the entropy of a given data block '''
    c = np.bincount(data, minlength=256)
    p = c.astype(np.float32) / len(data)
    wh = np.where(c)[0]
    H = np.sum(-p[wh] * np.log2(
        p[wh]))
    return H

def block_entropy(data, window=1024, step=256):
    Hbins = []
    if data.shape[0] < window:
        Hbin = H(data)
        Hbins.append(Hbin)
    else:
        shape = data.shape[:-1] + (data.shape[-1] - window + 1, window)
        strides = data.strides + (data.strides[-1],)
        blocks = np.lib.stride_tricks.as_strided(data, shape=shape, strides=strides)[::step, :]

        for block in blocks:
            Hbin = H(block)
            Hbins.append(Hbin)
    return Hbins

def bin2entropy(content, block_size=1024, step=256, resize=True):
    """
    following resources: https://github.com/gcmartinelli/entroPy/blob/master/entropy.py
    but fatser 6x time
    """
    data = np.frombuffer(content, dtype=np.uint8)
    entropy_list = block_entropy(data, block_size, step)
    width = imagesize(len(entropy_list))*2
    rn = len(entropy_list)/width
    matrix = np.reshape(entropy_list[:int(rn)*width],(int(rn),width))
    im = Image.fromarray(matrix * 255/8)
    if resize:
        im = im.resize((244,244))
    return im
结果如下图所示。可视化之后就可以作进一步分析了,比如对比加壳和正常文件;使用可视化图进行恶意识别。
另外,此处的二进制熵可视化主要参考【3】,但是进行了改进,比【3】中原始的方法计算熵图快了6倍以上。
源码见 github: https://github.com/Aida-yy/binai/blob/main/binai/feature_extraction/image.py

 浙公网安备 33010602011771号