import matplotlib.pyplot as plt
# 定义数据
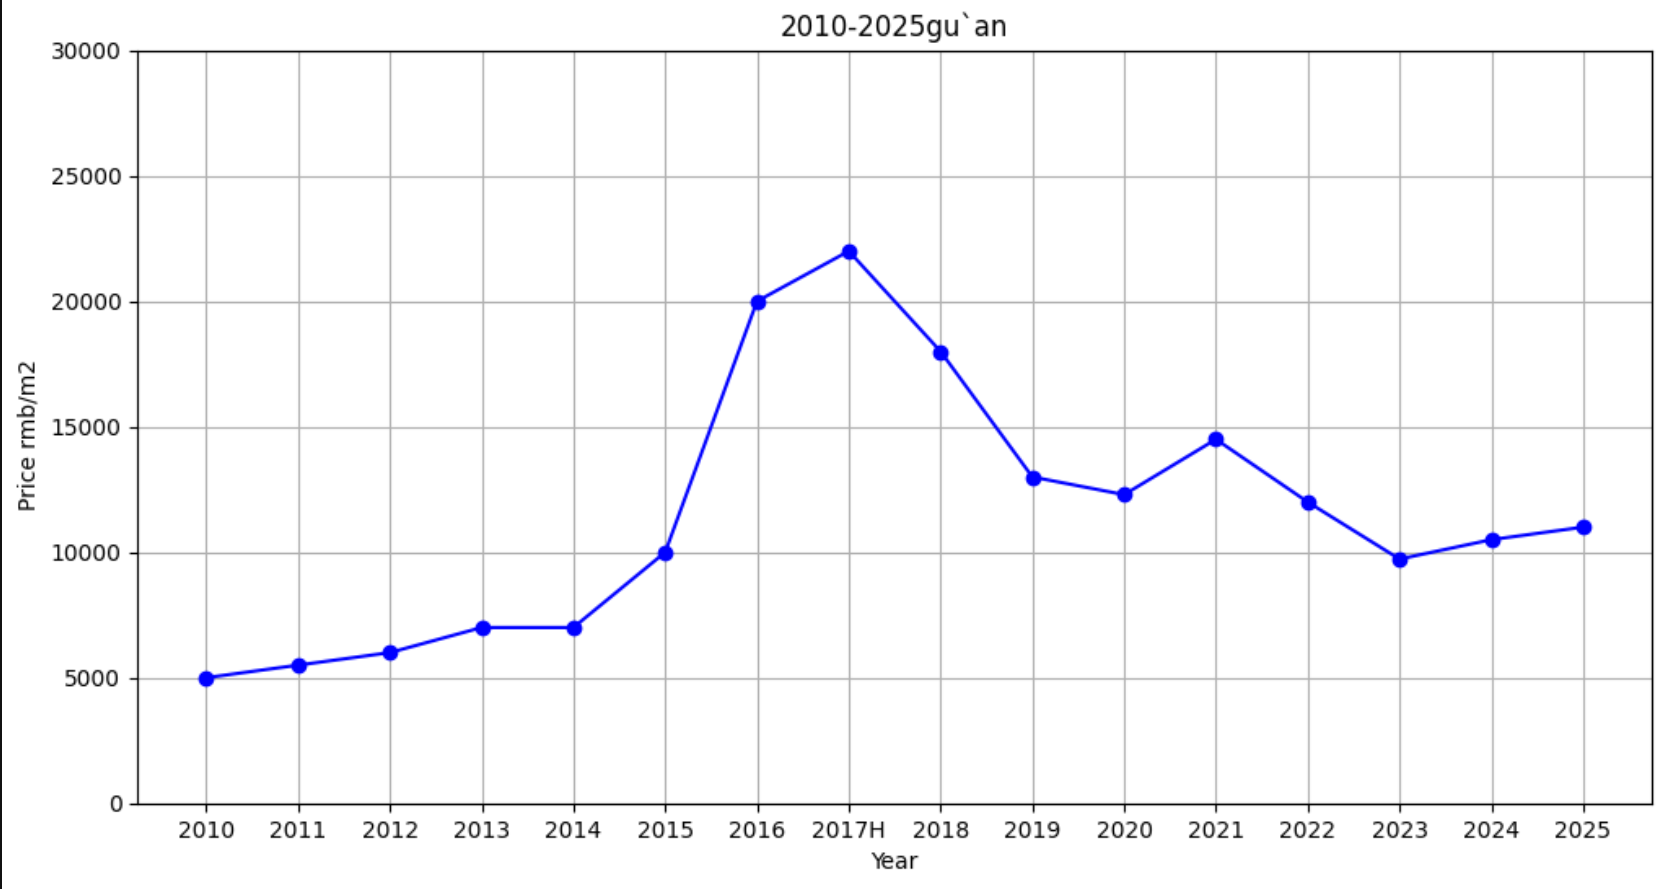
years = ["2010", "2011", "2012", "2013", "2014", "2015", "2016", "2017H", "2018", "2019", "2020", "2021", "2022", "2023", "2024", "2025"]
prices = [5000, 5500, 6000, 7000, 7000, 10000, 20000, 22000, 18000, 13000, 12294, 14500, 12000, 9727, 10500, 11000]
# 创建图表
plt.figure(figsize=(12, 6))
plt.plot(years, prices, marker='o', linestyle='-', color='b')
# 添加标题和标签
plt.title("2010-2025gu`an")
plt.xlabel("Year")
plt.ylabel("Price rmb/m2 ")
plt.ylim(0, 30000)
# 添加网格
plt.grid(True)
# 显示图表
plt.show()


 浙公网安备 33010602011771号