1 import os
2 from configparser import ConfigParser
3 import matplotlib.pyplot as plt
4
5 plt.rcParams['font.sans-serif']=['SimHei']
6 plt.rcParams['axes.unicode_minus']=False
7
8 configFile='config.ini'
9 #section列表
10 sectionList = []
11
12 #每行元素个数
13 elements = 0
14 #元素名称列表
15 nameList = []
16 #整理后的数据列表
17 elementsList = []
18
19 #待分析文件名称
20 txtFileName = ''
21
22 #判断字符串是否为浮点数
23 def isFloatNum(str):
24 s = str.split('.')
25 if len(s) > 2:
26 return False
27 else:
28 for si in s:
29 if not si.isdigit():
30 return False
31 return True
32
33 def readTxtFile():
34 #默认了文件存在
35 f = open(txtFileName , encoding='utf-8')
36 # 将文件按行读到list当中
37 data = f.readlines()
38
39 # 关文件
40 f.close()
41
42 #数据处理
43 for i in range(0 , len(data)):
44 global elements
45 global elementsList
46 line = data[i].replace('\n','')
47 elementList = line.split(',')
48 #分割后判断元素个数
49 if len(elementList) == elements:
50 isFloat = True
51 # 数据判断,判断每个数据是否是浮点数
52 for i in range(0,elements):
53 if isFloatNum(elementList[i]) == False:
54 isFloat = False
55 #如果本行数据符合分析格式
56 if isFloat == True:
57 for i in range(0,elements):
58 elementsList[i].append(float(elementList[i]))
59
60 else:
61 print("Discard the data:" + line)
62 else:
63 print("Discard the data:" + line)
64 # print(elementsList)
65 # print(len(data))
66 # print(data)
67
68
69
70 #读取配置文件
71 def readConfigFile():
72 global txtFileName
73 global elements
74 global nameList
75 global elementsList
76 file_path = os.path.join(os.path.dirname(os.path.abspath(__file__)), configFile)
77 cf = ConfigParser()
78 cf.read(configFile, encoding='utf-8')
79 #读取每行元素个数
80 elements = cf.getint('dataInfo', 'elements')
81 #读取元素名称
82 if elements > 0:
83 for i in range(0 , elements):
84 nameList.append(cf.get('dataInfo','C'+ str(i+1) + 'Name'))
85 elementsList.append([])
86 # print(nameList)
87 #读取待分析文件路径
88 txtFileName = cf.get('file','fileName')
89 print(txtFileName)
90
91 # sectionList = cf.sections()
92 # print(len(sectionList))
93 # print(sectionList)#['dataInfo']
94 #配置项
95 # print(cf.options('dataInfo'))#['elements', 'c1name', 'c2name', 'c3name', 'c4name', 'c5name', 'c6name']
96 #键值对
97 # print(cf.items('dataInfo'))
98
99 #获取值
100 # print(cf.getint('dataInfo','elements'))
101 # print(cf.get('dataInfo','C2Name'))
102
103 def drawPolyline():
104 global elementsList
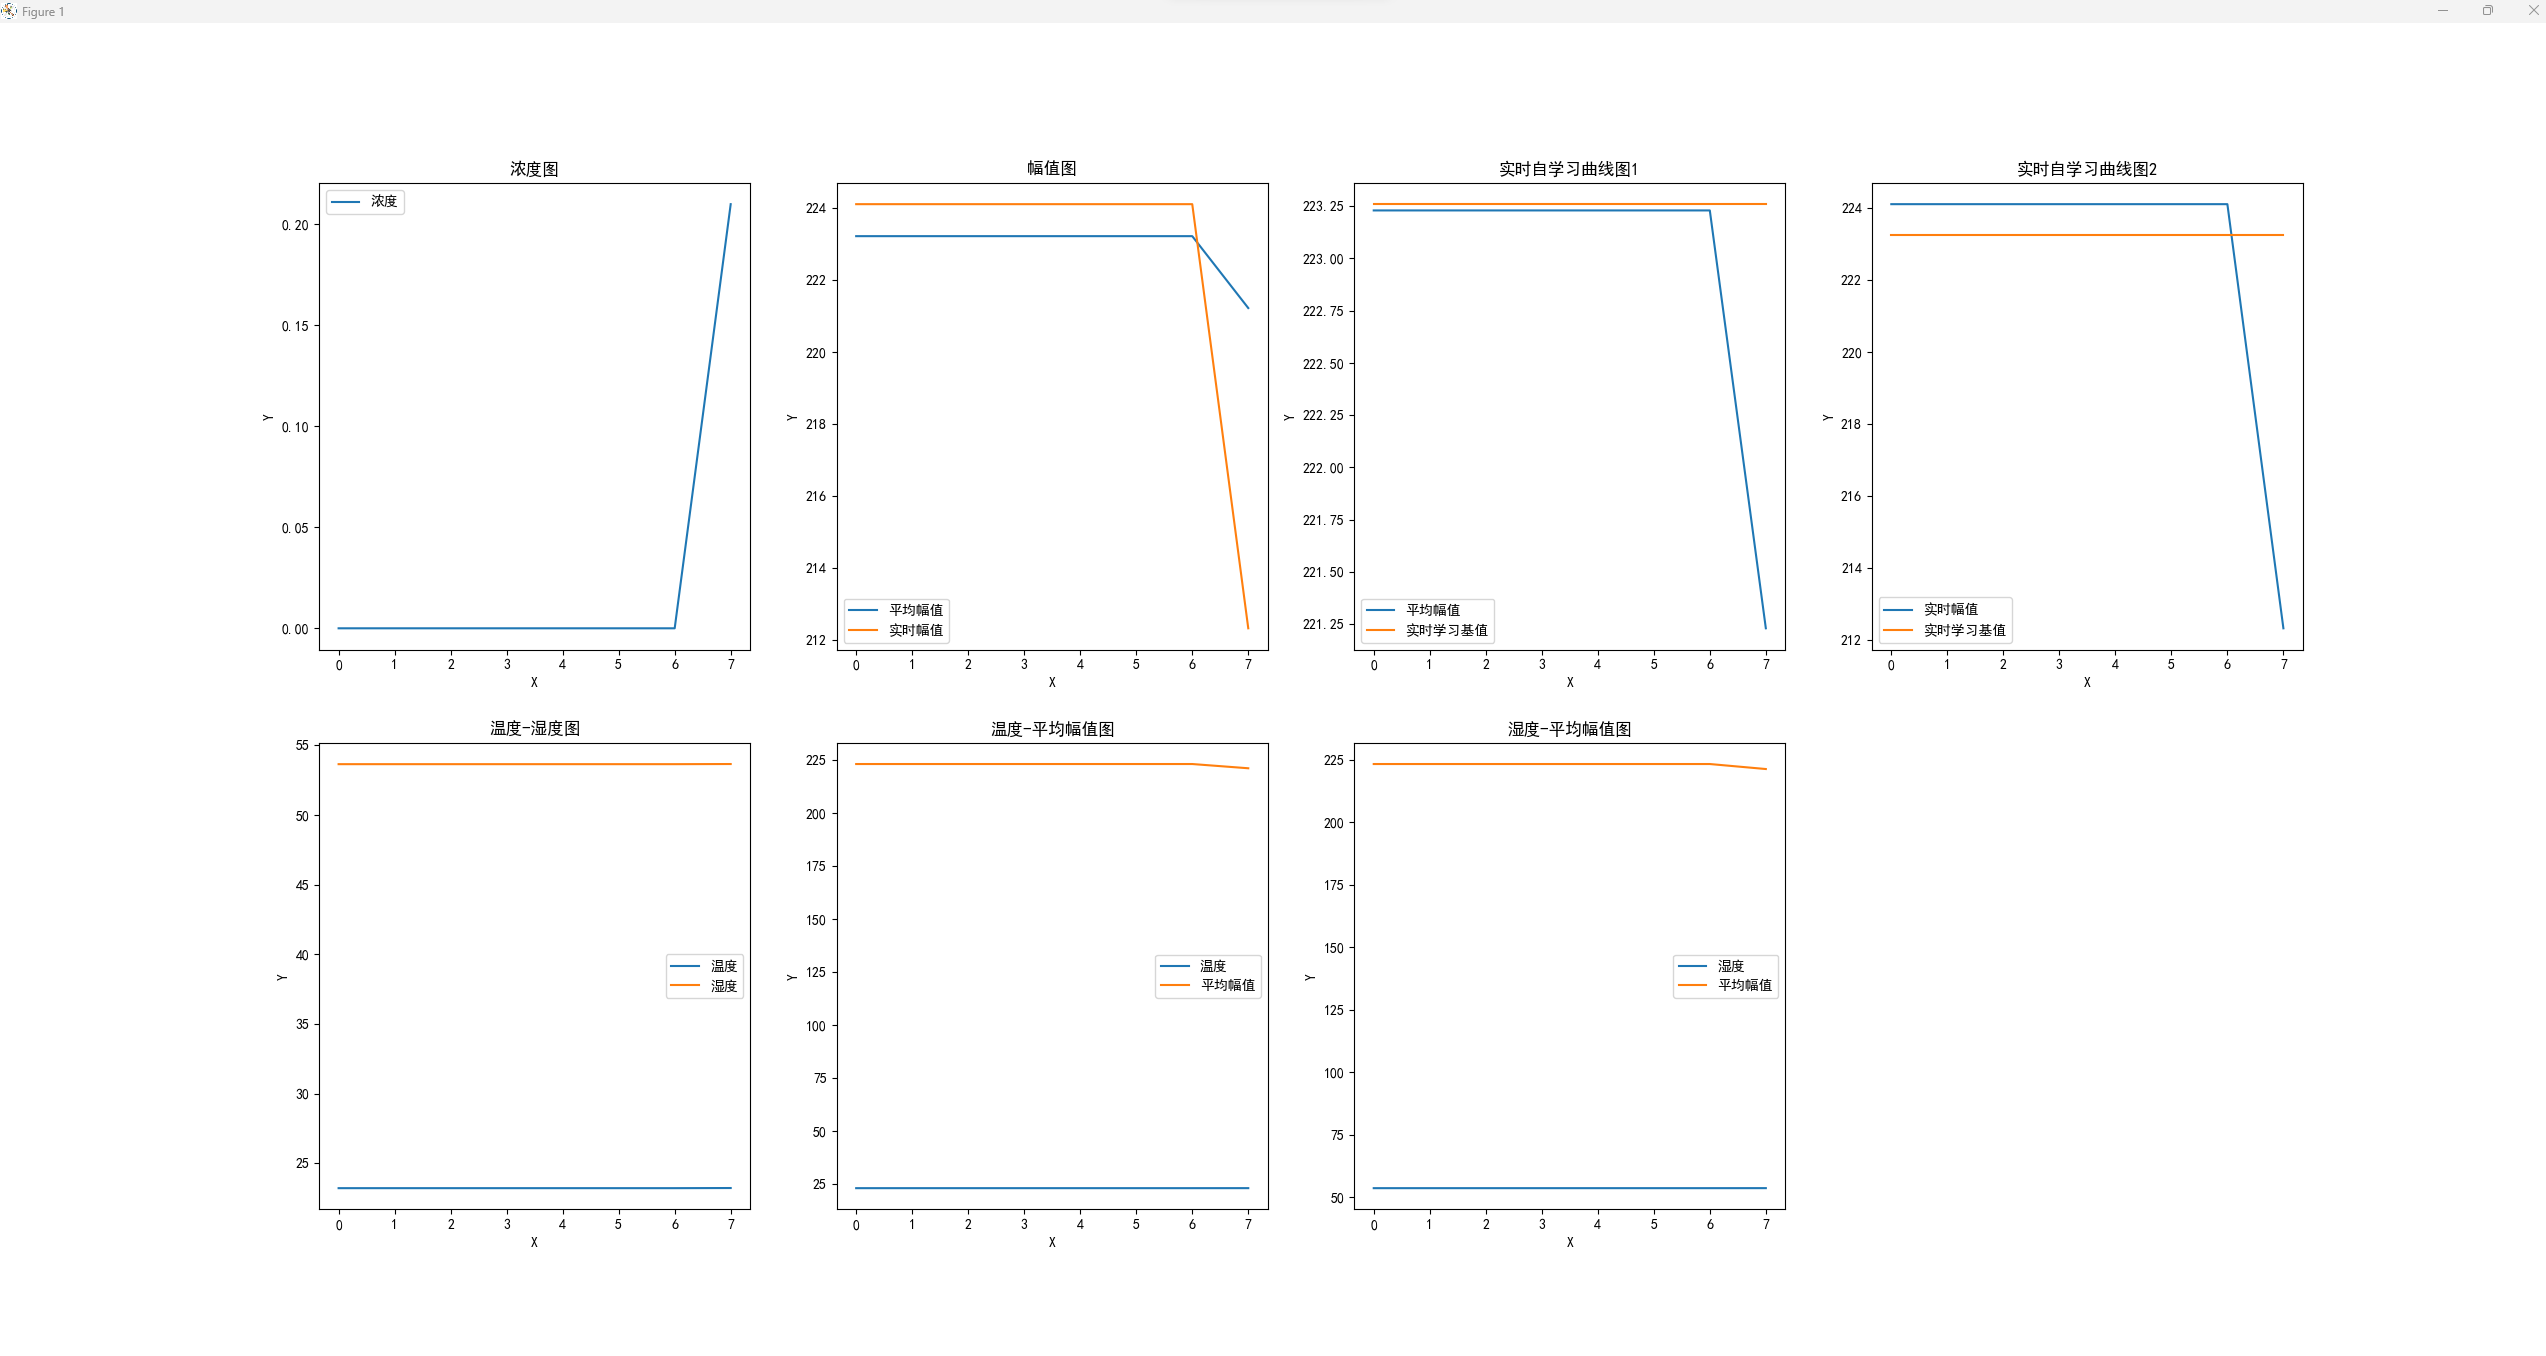
105 #第一个图
106 plt.subplot(2,4,1)
107 plt.title("浓度图")
108 plt.plot(elementsList[0],label="浓度")
109 plt.xlabel("X")
110 plt.ylabel("Y")
111 plt.legend()
112
113 #第二个图
114 plt.subplot(2,4,2)
115 plt.title("幅值图")
116 plt.plot(elementsList[1],label="平均幅值")
117 plt.plot(elementsList[2],label="实时幅值")
118 plt.xlabel("X")
119 plt.ylabel("Y")
120 plt.legend()
121
122 #第三个图
123 plt.subplot(2,4,3)
124 plt.title("实时自学习曲线图1")
125 plt.plot(elementsList[1],label="平均幅值")
126 plt.plot(elementsList[3],label="实时学习基值")
127 plt.xlabel("X")
128 plt.ylabel("Y")
129 plt.legend()
130
131 #第四个图
132 plt.subplot(2,4,4)
133 plt.title("实时自学习曲线图2")
134 plt.plot(elementsList[2],label="实时幅值")
135 plt.plot(elementsList[3], label="实时学习基值")
136 plt.xlabel("X")
137 plt.ylabel("Y")
138 plt.legend()
139
140 #第二列第一个图
141 plt.subplot(2,4,5)
142 plt.title("温度-湿度图")
143 plt.plot(elementsList[4],label="温度")
144 plt.plot(elementsList[5],label="湿度")
145 plt.xlabel("X")
146 plt.ylabel("Y")
147 plt.legend()
148
149 #第二列第二个图
150 plt.subplot(2,4,6)
151 plt.title("温度-平均幅值图")
152 plt.plot(elementsList[4],label="温度")
153 plt.plot(elementsList[1],label="平均幅值")
154 plt.xlabel("X")
155 plt.ylabel("Y")
156 plt.legend()
157
158 #第二列第三个图
159 plt.subplot(2,4,7)
160 plt.title("湿度-平均幅值图")
161 plt.plot(elementsList[5],label="湿度")
162 plt.plot(elementsList[1],label="平均幅值")
163 plt.xlabel("X")
164 plt.ylabel("Y")
165 plt.legend()
166
167
168 # for i in range(0,len(elementsList)):
169 # plt.plot(elementsList[i])
170 plt.show()
171
172 if __name__ == '__main__':
173 readConfigFile()
174 readTxtFile()
175 drawPolyline()
176 # See PyCharm help at https://www.jetbrains.com/help/pycharm/
#config.ini
#待解析文件名称
[file]
fileName=test.txt


#数据格式
[dataInfo]
#每行元素个数
elements=6
#第一个元素名称
C1Name=concentration
#第二个元素名称
C2Name=meanValue
#第三个元素名称
C3Name=realTimeValue
#第四个元素名称
C4Name=baseValue
#第五个元素名称-温度
C5Name=temp
#第六个元素名称-湿度
C6Name=humi

#设备数据绘制曲线参数
[devDisplay]
#放大倍数
devC1Magn=1
devC2Magn=1
devC3Magn=1
devC4Magn=1
devC5Magn=1
devC6Magn=1

#显示的列号
devDisColumn = 1,2,3,4,5,6
![]()

 浙公网安备 33010602011771号