Prometheus&Grafana的安装及简单使用
一、Prometheus架构
1.什么是Prometheus
Prometheus是一个开源系统监控和警报工具包,最初由SoundCloud构建。自2012年成立以来,许多公司和组织都采用了Prometheus,该项目拥有非常活跃的开发人员和用户社区。
它现在是一个独立的开源项目,独立于任何公司进行维护。为了强调这一点,并澄清该项目的治理结构,Prometheus于2016年加入云原生计算基金会(CNCF),成为继Kubernetes(k8s)之后的第二个托管项目。
官网地址:
https://prometheus.io/docs/introduction/overview/
2.架构图解
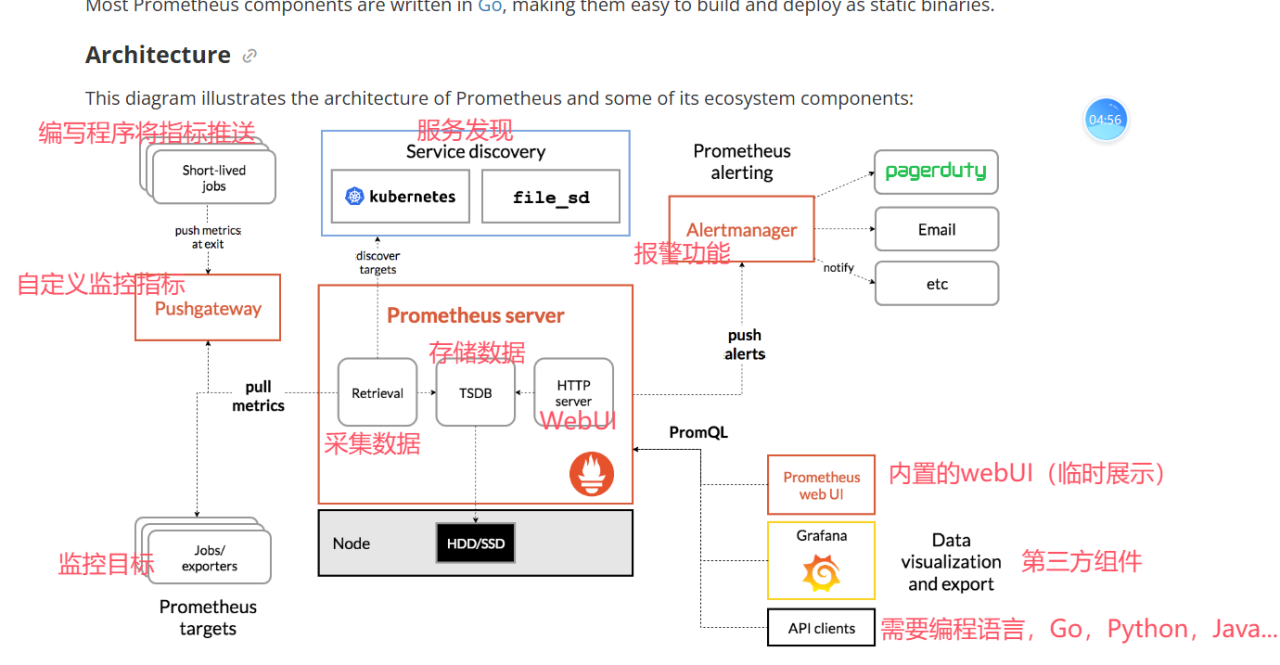
二、Prometheus架构组件
-
Prometheus Server
- 1.采集目标主机(服务发现)
- 2.数据存储(本地,远端)
- 3.临时查询的webUI
-
exporters:
- 指的是Prometheus将来要监控的目标,这些exporter以http|https协议暴露Prometheus能够识别的数据格式
- 一般都是社区研发好的监控指标。
- 需要单独部署,通常指的是一类export程序,比如: mysql_exporter,reids_exporter,mongodb_exporter,...
-
pushgateway
- 用于采集用户自定义的指标,自定义指标的数据必须上传到pushgateway后,由该组件帮你转换为Prometheus能够识别的数据格式。
- 需要单独部署的组件
-
Alertmanager
- 用于实现报警功能的组件,支持邮箱,钉钉,微信等媒介。
- 需要单独部署
-
Grafana
- 以图形化展示Prometheus的数据,提供持久化的Dashboard
- 需要单独部署
三、Prometheus server部署方式
1.官方提供的部署方式
- 二进制部署(常用)
- docker部署
2.社区部署方式
-
基于Operator
https://github.com/prometheus-operator/kube-prometheus -
基于helm
-
编译安装(需要有go语言的SDK)
3.自定义基于K8s的控制器实现部署
四、二进制部署&卸载Prometheus
①不使用脚本
1.下载软件包
wget https://github.com/prometheus/prometheus/releases/download/v2.53.4/prometheus-2.53.4.linux-amd64.tar.gz
2.解压软件包
[root@prometheus-server31 ~]# tar xf prometheus-2.53.4.linux-amd64.tar.gz
3.启动Prometheus
[root@prometheus-server31 ~]# cd prometheus-2.53.4.linux-amd64/
[root@prometheus-server31 prometheus-2.53.4.linux-amd64]# ./prometheus
4.Prometheus的数据存储目录
[root@prometheus-server31 prometheus-2.53.4.linux-amd64]# ll data/  # 在启动目录中会产生一个data用于存放数据
total 20
drwxr-xr-x 4 root root           4096 Mar 26 09:38 ./
drwxr-xr-x 5 1001 fwupd-refresh  4096 Mar 26 09:37 ../
drwxr-xr-x 2 root root           4096 Mar 26 09:37 chunks_head/
-rw-r--r-- 1 root root          20001 Mar 26 09:37 queries.active
drwxr-xr-x 2 root root           4096 Mar 26 09:37 wal/
5.卸载Prometheus
#直接删除解压后的软件包即可
[root@prometheus-server31 ~]# rm -rf prometheus-2.53.4.linux-amd64*
②使用脚本一键部署
1.编写脚本
2.使用脚本安装
[root@prometheus-server31 ~]# ./install-prometheus-server.sh i
3.访问测试
http://10.0.0.31:9090/targets
五、部署&卸载node-exporter
node-exporter是Prometheus官方提供的一款用于暴露Linux系统常用指标,包括但不限于CPU,内存,磁盘,网络,负载等指标
https://prometheus.io/download/#node_exporter

①二进制部署
1.下载node-exporter
wget https://github.com/prometheus/node_exporter/releases/download/v1.9.0/node_exporter-1.9.0.linux-amd64.tar.gz
2.解压安装包
[root@node-exporter41 ~]# tar xf node_exporter-1.9.0.linux-amd64.tar.gz
[root@node-exporter41 ~]#
[root@node-exporter41 ~]# cd node_exporter-1.9.0.linux-amd64/
[root@node-exporter41 node_exporter-1.9.0.linux-amd64]#
[root@node-exporter41 node_exporter-1.9.0.linux-amd64]# ll
total 21684
drwxr-xr-x 2 1001 1002     4096 Feb 17 15:27 ./
drwx------ 6 root root     4096 Mar 26 10:12 ../
-rw-r--r-- 1 1001 1002    11357 Feb 17 15:27 LICENSE
-rwxr-xr-x 1 1001 1002 22177618 Feb 17 15:23 node_exporter*
-rw-r--r-- 1 1001 1002      463 Feb 17 15:27 NOTICE
3.运行node-exporter
[root@node-exporter41 node_exporter-1.9.0.linux-amd64]# ./node_exporter
4.访问node-exporter的webUI
http://10.0.0.41:9100/metrics
5.卸载node-exporter
[root@node-exporter41 ~]# rm -rf node_exporter-1.9.0.linux-amd64
②脚本部署
1.编写脚本
2.安装node-exporter
[root@node-exporter43 ~]# ./install-node-exporter.sh i
3.访问测试
http://10.0.0.43:9100/metrics
4.卸载服务
[root@node-exporter43 ~]# ./install-node-exporter.sh r
六、Prometheus监控Linux主机
1.修改Prometheus的配置文件
[root@prometheus-server31 ~]# vim /dezyan/softwares/prometheus-2.53.4.linux-amd64/prometheus.yml
...
global:
	#监控提交时间
  scrape_interval: 3s
  ...

scrape_configs
  ...
  #末尾添加主机
  - job_name: linux-node-exporter
    static_configs:
      - targets:
        - 10.0.0.41:9100
        - 10.0.0.42:9100
        - 10.0.0.43:9100
2.热加载服务
[root@prometheus-server31 ~]# curl -X POST http://10.0.0.31:9090/-/reload
3.访问测试
http://10.0.0.31:9090/targets

七、Prometheus的标签匹配
官方文档
https://prometheus.io/docs/prometheus/latest/querying/operators/#aggregation-operators
https://prometheus.io/docs/prometheus/latest/querying/functions/
1.不匹配任何标签,仅查询某个特定的KEY
node_cpu_seconds_total
2.查看某个特定节点的指标
node_cpu_seconds_total{instance="10.0.0.42:9100",mode="idle"}
3.支持正则匹配过滤标签
node_cpu_seconds_total{instance="10.0.0.42:9100",mode=~"i.*"}
node_cpu_seconds_total{instance="10.0.0.42:9100",mode=~"system|user"}
4.支持取反操作
node_cpu_seconds_total{instance="10.0.0.42:9100",mode!~"i.*"}
5.支持算数运算(统计每个节点的内存大小)
node_memory_MemTotal_bytes/1024/1024/1024
6.支持聚合操作
6.1 统计集群的核心数
count(node_cpu_seconds_total{mode="idle"})
6.2 统计每个节点的CPU核心数(by的作用就是分组)
count(node_cpu_seconds_total{mode="idle"}) by (instance)
6.3 查看前5个指标
topk(5,node_cpu_seconds_total)
6.4 查看后3个指标
bottomk(3,node_cpu_seconds_total)
7.统计cpu使用率
(1 - sum(increase(node_cpu_seconds_total{mode="idle"}[1m])) by (instance) / sum(increase(node_cpu_seconds_total[1m])) by (instance))*100
8.压力测试
[root@node-exporter42 ~]# apt -y install stress
[root@node-exporter42 ~]# stress --cpu 8 --io 4 --vm 2 --vm-bytes 128M --timeout 10m
stress: info: [1507] dispatching hogs: 8 cpu, 4 io, 2 vm, 0 hdd
八、grafana环境部署实战
1.下载grafana
grafana是一款开源的图形化展示工具,支持多个数据源,包括但不限于MySQL,ElasticSearch,Prometheus,PostgreSQL等

官方下载地址
https://grafana.com/grafana/download
wget https://dl.grafana.com/enterprise/release/grafana-enterprise_9.5.21_amd64.deb
2.安装依赖
[root@prometheus-server31 ~]# apt-get install -y adduser libfontconfig1 musl
3.安装grafana
[root@prometheus-server31 ~]# dpkg -i grafana-enterprise_9.5.21_amd64.deb
4.启动grafana
[root@prometheus-server31 ~]# systemctl enable --now grafana-server
[root@prometheus-server31 ~]# ss -ntl | grep 3000
LISTEN 0      4096               *:3000            *:*
5.访问grafana的WebUI
http://10.0.0.31:3000/

用户名: admin
密  码: admin

九、基于grafana查询Prometheus数据
https://www.cnblogs.com/dezyan/p/18794654
十、grafana导入官方模板ID的流程
1.配置数据源正确
2.去官网查询要展示数据模板ID
	参考链接:
		https://grafana.com/grafana/dashboards/
3.在本地的Dashboard导入grafana官网的模板ID即可
十一、grafana自定义Dashboard
https://www.cnblogs.com/dezyan/p/18794720
十二、grafana的变量定义
https://www.cnblogs.com/dezyan/p/18794811
十三、grafana实现表格制作
https://www.cnblogs.com/dezyan/p/18794838
十四、grafana的数据备份和恢复
https://www.cnblogs.com/dezyan/p/18794923
十五、grafana的基于角色的访问控制RBAC
https://www.cnblogs.com/dezyan/p/18794938
十六、grafana配置ES作为数据源实战
十七、Prometheus监控window主机
1.下载windows的exporter
2.双击运行
3.访问测试
http://10.0.0.1:9182/metrics
4.修改Prometheus的配置文件
[root@prometheus-server31 ~]# vim /dezyan/softwares/prometheus-2.53.4.linux-amd64/prometheus.yml
...
  - job_name: windows-exporter
    static_configs:
      - targets:
        - 10.0.0.1:9182
5.热加载配置
[root@prometheus-server31 ~]# curl -X POST http://10.0.0.31:9090/-/reload
6.验证配置是否生效
http://10.0.0.31:9090/targets?search=
7.grafana导入模板ID
例如
	20763
	14694
本文来自博客园,作者:丁志岩,转载请注明原文链接:https://www.cnblogs.com/dezyan/p/18794577

 浙公网安备 33010602011771号