并行计算架构和编程 | Assignment 1: Performance Analysis on a Quad-Core CPU

Assignment 1: Performance Analysis on a Quad-Core CPU
Environment Setup
-
CPU信息
Architecture: x86_64 CPU op-mode(s): 32-bit, 64-bit Address sizes: 46 bits physical, 57 bits virtual Byte Order: Little Endian CPU(s): 160 On-line CPU(s) list: 0-159 Vendor ID: GenuineIntel Model name: Intel(R) Xeon(R) Platinum 8383C CPU @ 2.70GHz CPU family: 6 Model: 106 Thread(s) per core: 2 Core(s) per socket: 40 Socket(s): 2 Stepping: 6 CPU max MHz: 3600.0000 CPU min MHz: 800.0000 BogoMIPS: 5400.00 -
install the Intel SPMD Program Compiler (ISPC) available here: http://ispc.github.io/
wget https://github.com/ispc/ispc/releases/download/v1.26.0/ispc-v1.26.0-linux.tar.gz tar -xvf ispc-v1.26.0-linux.tar.gz && rm ispc-v1.26.0-linux.tar.gz # Add the ISPC bin directory to your system path. export ISPC_HOME=/home/cilinmengye/usr/ispc-v1.26.0-linux export PATH=$ISPC_HOME/bin:$PATH -
The assignment starter code is available on https://github.com/stanford-cs149/asst1
Program 1: Parallel Fractal Generation Using Threads (20 points)
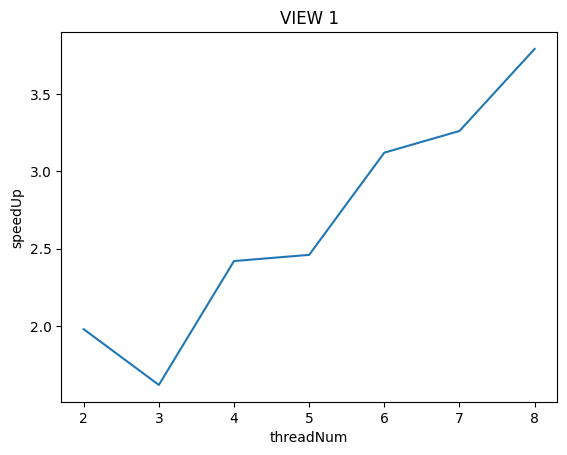
**Is speedup linear in the number of threads used? **
In your writeup hypothesize why this is (or is not) the case?
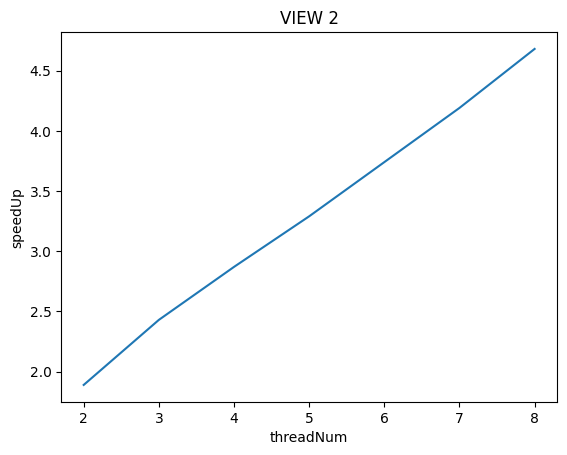
(you may also wish to produce a graph for VIEW 2 to help you come up with a good answer. Hint: take a careful look at the three-thread datapoint.)
To confirm (or disprove) your hypothesis, measure the amount of time each thread requires to complete its work by inserting timing code at the beginning and end of workerThreadStart()
VIEW 1:
[mandelbrot thread 0]:          [333.949] ms
[mandelbrot thread 1]:          [356.226] ms

[mandelbrot thread 0]:          [131.044] ms
[mandelbrot thread 2]:          [154.097] ms
[mandelbrot thread 1]:          [428.861] ms

[mandelbrot thread 0]:          [62.530] ms
[mandelbrot thread 3]:          [83.256] ms
[mandelbrot thread 1]:          [291.673] ms
[mandelbrot thread 2]:          [292.539] ms

[mandelbrot thread 0]:          [28.683] ms
[mandelbrot thread 4]:          [50.483] ms
[mandelbrot thread 1]:          [193.241] ms
[mandelbrot thread 3]:          [193.720] ms
[mandelbrot thread 2]:          [288.939] ms

[mandelbrot thread 0]:          [17.357] ms
[mandelbrot thread 5]:          [37.675] ms
[mandelbrot thread 1]:          [134.275] ms
[mandelbrot thread 4]:          [134.862] ms
[mandelbrot thread 2]:          [223.723] ms
[mandelbrot thread 3]:          [224.468] ms

[mandelbrot thread 0]:          [13.236] ms
[mandelbrot thread 6]:          [32.660] ms
[mandelbrot thread 1]:          [95.954] ms
[mandelbrot thread 5]:          [97.984] ms
[mandelbrot thread 2]:          [166.271] ms
[mandelbrot thread 4]:          [167.878] ms
[mandelbrot thread 3]:          [214.565] ms

[mandelbrot thread 0]:          [9.987] ms
[mandelbrot thread 7]:          [28.890] ms
[mandelbrot thread 1]:          [75.118] ms
[mandelbrot thread 6]:          [75.412] ms
[mandelbrot thread 2]:          [130.862] ms
[mandelbrot thread 5]:          [131.121] ms
[mandelbrot thread 3]:          [185.480] ms
[mandelbrot thread 4]:          [186.073] ms
VIEW 2:
[mandelbrot thread 1]:          [177.231] ms
[mandelbrot thread 0]:          [226.604] ms

[mandelbrot thread 2]:          [120.581] ms
[mandelbrot thread 1]:          [128.685] ms
[mandelbrot thread 0]:          [174.056] ms

[mandelbrot thread 3]:          [98.259] ms
[mandelbrot thread 1]:          [101.493] ms
[mandelbrot thread 2]:          [102.176] ms
[mandelbrot thread 0]:          [147.582] ms

[mandelbrot thread 5]:          [68.970] ms
[mandelbrot thread 4]:          [73.143] ms
[mandelbrot thread 2]:          [73.587] ms
[mandelbrot thread 3]:          [76.763] ms
[mandelbrot thread 1]:          [82.289] ms
[mandelbrot thread 0]:          [112.975] ms

[mandelbrot thread 6]:          [59.428] ms
[mandelbrot thread 2]:          [60.442] ms
[mandelbrot thread 4]:          [63.801] ms
[mandelbrot thread 5]:          [66.606] ms
[mandelbrot thread 3]:          [71.558] ms
[mandelbrot thread 1]:          [78.108] ms
[mandelbrot thread 0]:          [100.265] ms

[mandelbrot thread 7]:          [53.217] ms
[mandelbrot thread 5]:          [57.710] ms
[mandelbrot thread 2]:          [57.926] ms
[mandelbrot thread 3]:          [61.531] ms
[mandelbrot thread 4]:          [62.739] ms
[mandelbrot thread 6]:          [63.645] ms
[mandelbrot thread 1]:          [77.445] ms
[mandelbrot thread 0]:          [90.286] ms
可以通过对比VIEW 1和VIEW 2在不同线程数执行时各个线程的运行时间上看,VIEW 1具有严重的负载不均衡问题。特别是在VIEW 1下用3个线程执行时,thread 1运行时间居然高达428.861ms是其他线程运行时间的4倍!
这导致VIEW 1下用3个线程运行比用2个线程运行的加速比还要低!
VIEW 2显示出来了较为良好的负载均衡
为什么呢?其实我们可以从PPM图中看出:

上图为VIEW 1生成的PPM,按照我的策略,在使用3个线程执行时,从下到上的三个区域分别由thread0,1,2负责.
判断(x,y)坐标是否在mandelbrot集合中是由代码中static inline int mandel(float c_re, float c_im, int count)函数进行计算的。当算出(x,y)坐标越“接近”mandelbrot集合中,那么图中在(x,y)坐标上显示地越白。
关键是(x,y)坐标越“接近”mandelbrot集合,在mandel函数中迭代得越久(最大为256)。从上图中可以看到VIEW 1 thread1负责的区域相对与thread 0, thread 2有大片的空白,说明thread 1的计算量更大。

来看看VIEW 2的图,可以看到白点的分别就均匀许多了。
这里的代码具体参见mandelbrotThreadV1.cpp
Modify the mapping of work to threads to achieve to improve speedup to at about 7-8x on both views of the Mandelbrot set. In your writeup, describe your approach to parallelization and report the final 8-thread speedup obtained.
VIEW 1
[mandelbrot thread 0]:          [334.905] ms
[mandelbrot thread 1]:          [355.082] ms

[mandelbrot thread 0]:          [223.479] ms
[mandelbrot thread 1]:          [244.310] ms
[mandelbrot thread 2]:          [244.273] ms

[mandelbrot thread 0]:          [167.591] ms
[mandelbrot thread 1]:          [188.222] ms
[mandelbrot thread 3]:          [188.149] ms
[mandelbrot thread 2]:          [188.211] ms

[mandelbrot thread 0]:          [134.268] ms
[mandelbrot thread 1]:          [155.675] ms
[mandelbrot thread 4]:          [155.588] ms
[mandelbrot thread 3]:          [155.652] ms
[mandelbrot thread 2]:          [155.684] ms

[mandelbrot thread 0]:          [111.937] ms
[mandelbrot thread 2]:          [132.946] ms
[mandelbrot thread 4]:          [132.864] ms
[mandelbrot thread 1]:          [132.969] ms
[mandelbrot thread 3]:          [132.941] ms
[mandelbrot thread 5]:          [132.888] ms

[mandelbrot thread 0]:          [95.648] ms
[mandelbrot thread 1]:          [116.998] ms
[mandelbrot thread 3]:          [116.925] ms
[mandelbrot thread 2]:          [116.974] ms
[mandelbrot thread 4]:          [116.892] ms
[mandelbrot thread 6]:          [116.812] ms
[mandelbrot thread 5]:          [117.228] ms

[mandelbrot thread 0]:          [85.144] ms
[mandelbrot thread 1]:          [104.262] ms
[mandelbrot thread 4]:          [104.145] ms
[mandelbrot thread 2]:          [104.286] ms
[mandelbrot thread 3]:          [104.250] ms
[mandelbrot thread 7]:          [106.611] ms
[mandelbrot thread 5]:          [106.744] ms
[mandelbrot thread 6]:          [106.666] ms

VIEW 2
[mandelbrot thread 0]:          [191.501] ms
[mandelbrot thread 1]:          [212.256] ms

[mandelbrot thread 0]:          [127.668] ms
[mandelbrot thread 2]:          [149.055] ms
[mandelbrot thread 1]:          [149.279] ms

[mandelbrot thread 0]:          [95.970] ms
[mandelbrot thread 1]:          [115.653] ms
[mandelbrot thread 3]:          [115.783] ms
[mandelbrot thread 2]:          [115.902] ms

[mandelbrot thread 0]:          [76.880] ms
[mandelbrot thread 2]:          [97.456] ms
[mandelbrot thread 1]:          [97.590] ms
[mandelbrot thread 4]:          [97.547] ms
[mandelbrot thread 3]:          [97.708] ms

[mandelbrot thread 0]:          [64.118] ms
[mandelbrot thread 3]:          [83.671] ms
[mandelbrot thread 4]:          [83.687] ms
[mandelbrot thread 2]:          [83.868] ms
[mandelbrot thread 1]:          [84.021] ms
[mandelbrot thread 5]:          [83.885] ms

[mandelbrot thread 0]:          [55.046] ms
[mandelbrot thread 6]:          [75.713] ms
[mandelbrot thread 5]:          [75.799] ms
[mandelbrot thread 4]:          [75.939] ms
[mandelbrot thread 3]:          [76.110] ms
[mandelbrot thread 2]:          [76.357] ms
[mandelbrot thread 1]:          [76.464] ms

[mandelbrot thread 0]:          [48.182] ms
[mandelbrot thread 7]:          [68.148] ms
[mandelbrot thread 6]:          [68.219] ms
[mandelbrot thread 5]:          [68.308] ms
[mandelbrot thread 4]:          [68.495] ms
[mandelbrot thread 3]:          [68.535] ms
[mandelbrot thread 2]:          [68.653] ms
[mandelbrot thread 1]:          [68.736] ms
我真的尽量了,写了3种不同的方法对任务分配进行改进:
-
按照行进行划分区域,然后使用轮转的策略让不同线程负责不同的行,如下:
... 2 1 0 2 1 0 2 1 0 -
按照行进行划分区域,然后使用轮转的策略让不同线程负责不同的行,但是不按照固定顺序,如下:
... 1 0 2 0 2 1 2 1 0 -
按照点进行划分区域,然后使用轮转的策略让不同线程负责不同的点,如下
... 0 1 2 0 1 2 0 1 2 0 1 2
但是最终结果在使用8线程V1最多有6.75的加速比,V2最多有6.00的加速比
threadNum = np.array([k for k in range(2, 9)])
speedUpV1 = np.array([1.98, 1.62, 2.42, 2.46, 3.12, 3.26, 3.79])
speedUpV2 = np.array([1.89, 2.43, 2.87, 3.29, 3.74, 4.19, 4.68])
speedUpV1_V1 = np.array([2.00, 2.89, 3.76, 4.55, 5.32, 6.02, 6.67])
speedUpV1_V2 = np.array([1.97, 2.82, 3.58, 4.31, 4.96, 5.54, 6.04])
plt.plot(threadNum, speedUpV1, marker = 'o', label = 'methord1_V1')
plt.plot(threadNum, speedUpV2, marker = 'o', label = 'methord1_V2')
plt.plot(threadNum, speedUpV1_V1, marker = 'o', label = 'methord2_V1')
plt.plot(threadNum, speedUpV1_V2, marker = 'o', label = 'methord2_V2')
plt.xlabel("threadNum")
plt.ylabel("speedUp")
plt.legend()
plt.show()
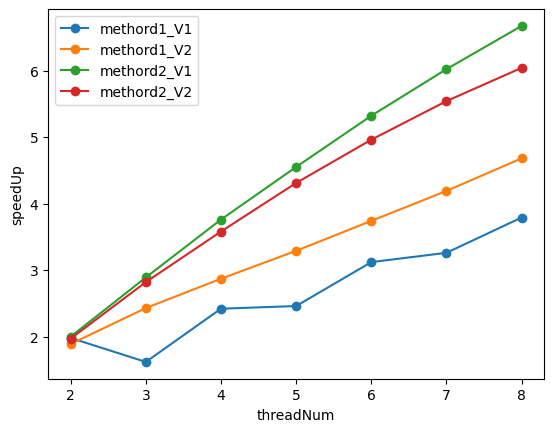
methord1是初始未进行改进的方法,methord2是改进后的方法
Now run your improved code with 16 threads. Is performance noticably greater than when running with eight threads? Why or why not?
我的结果是如下:
6.73x speedup from 8 threads
11.16x speedup from 16 threads
因为我的机器有80个核,所以并不会受到核的限制,当增加线程到16时,看起来加速比也提高了1.67倍左右。
但是原作业中只有8核,用16个线程是会启用到超线程的,但是超线程本质上是两个逻辑线程共用同一组计算部件,肯定性能上比一个core上运行一个线程要差。
BUG1: 浮点数计算的精度问题
若需精确控制小数位数,应避免直接依赖浮点数,改用高精度库或字符串处理。
在框架代码中,有检查serial版本和thread版本最终output结果是否相同的判断,但是在浮点数计算中可能遇到浮点数精度问题导致的数值最终不一样的问题,比如框架代码中:
    for (int j = startRow; j < endRow; j++) {
        for (int i = 0; i < width; ++i) {
            float x = x0 + i * dx;
            float y = y0 + j * dy;
            int index = (j * width + i);

            output[index] = mandel(x, y, maxIterations);
        }
    }
serial版本和thread版本中,dy,dx的值分别一样,但是在serial中,当 y0 = -1, j = 601时, 计算出来的y 和 在thread中, 当 y0 = -1 + 600 * dy, j = 1时, 计算出来的y,都结果不一样。
所以thread版本需要让y0,x0以及i,j与serial版本一样才能最保证结果相同。
Program 2: Vectorizing Code Using SIMD Intrinsics (20 points)
Run
./myexp -s 10000and sweep the vector width from 2, 4, 8, to 16. Record the resulting vector utilization. You can do this by changing the#define VECTOR_WIDTHvalue inCS149intrin.h. Does the vector utilization increase, decrease or stay the same asVECTOR_WIDTHchanges? Why?
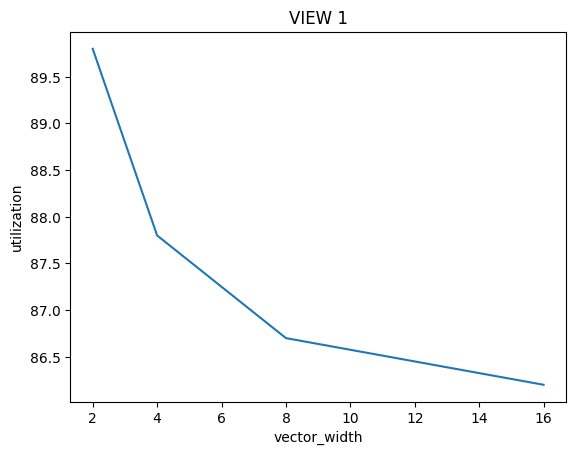
结果看起来是decrease的,首先我们要搞清楚Vector Utilization的计算方式:
\(Vector \ Utilization = \frac{Utilized \ Vector \ Lanes}{Total \ Vector \ Lanes}\)
\(Total \ Vector \ Lanes = Total \ Vector \ Instructions * Vector \ Width\)
同时有很多因素导致在一次Vector指令操作时,Vector Lanes不能得到充分利用:
- 分支判断if
- 循环while
这些语句总是会导致lane会有停用等待的情况,当Vector Width成倍数增长时,Total Vector Instructions并非成倍数的下降,Utilized Vector Lanes也并非成倍数的上升
Program 3: Parallel Fractal Generation Using ISPC (20 points)
Program 3, Part 1. A Few ISPC Basics (10 of 20 points)
在讲义中所给的ISPC案例中也是画出mandelbrot,但是使用的for循环不同:
    for (uniform int j = 0; j < height; j++) {
        foreach (i = 0 ... width) {
DeepSeek:
执行逻辑:
- 外层循环:j 是 uniform 变量,所有程序实例(SIMD Lane)共享同一 j 值,逐次迭代。
- 内层循环:foreach 对 i 并行化,每个实例处理不同的 i 值(varying 类型)。
并行粒度:- 横向并行:每行(固定 j)内所有 i 并行处理。
- 纵向串行:行间(不同 j)顺序执行。
适用场景:- 行间有数据依赖(如累积操作)。
- 需要逐行处理(如内存访问局部性优化)。
行间无法并行化,可能限制性能上限。
在Lab代码中的for循环如下:
foreach (j = 0 ... height, i = 0 ... width) {
但是我测试了下两个版本运行时间几乎没有差多少。
What is the maximum speedup you expect given what you know about these CPUs?
因为是在单CPU内进行加速,且ISPC 编译器当前被设置为发出 8 宽度的 AVX2 向量指令。这意味着该编译器在进行编译时,会生成能够利用 AVX2 指令集中 8 个数据元素同时进行处理的向量指令。所以应该是8倍的加速比
What is the maximum speedup you expect given what you know about these CPUs? Why might the number you observe be less than this ideal?
./mandelbrot_ispc -v 1
[mandelbrot serial]:            [335.077] ms
Wrote image file mandelbrot-serial.ppm
[mandelbrot ispc]:              [66.683] ms
Wrote image file mandelbrot-ispc.ppm
                                (5.02x speedup from ISPC)


./mandelbrot_ispc -v 2
[mandelbrot serial]:            [193.471] ms
Wrote image file mandelbrot-serial.ppm
[mandelbrot ispc]:              [45.919] ms
Wrote image file mandelbrot-ispc.ppm
                                (4.21x speedup from ISPC)
可以看到V1比V2运行时间长很多,但是加速比比V2大,考虑图形和分配任务的方式,猜测是program 1中同样的问题:负载不均衡
Program 3, Part 2: ISPC Tasks (10 of 20 points)
You will make a simple fix to Program 3 which is written in a combination of C++ and ISPC (the error causes a performance problem, not a correctness one). With the correct fix, you should observe performance that is over 32 times greater than that of the original sequential Mandelbrot implementation from mandelbrotSerial().
错误主要在于mandelbrot_ispc_task函数中不能对非整除height时的yend变量进行正常处理。
Run mandelbrot_ispc with the parameter --tasks. What speedup do you observe on view 1? What is the speedup over the version of mandelbrot_ispc that does not partition that computation into tasks?
- 没有划分的加速比:5.03
- task 2 划分后的加速比:9.37
How did you determine how many tasks to create? Why does the number you chose work best?
逐个尝试法,其余方法论我也不太清楚:
taskNums = np.array([1, 2, 4, 8, 16, 32, 40, 48, 56, 64])
speedups = np.array([5.03, 9.37, 6.90, 9.33, 13.39, 22.67, 28.47, 34.56, 37.79, 42.86])
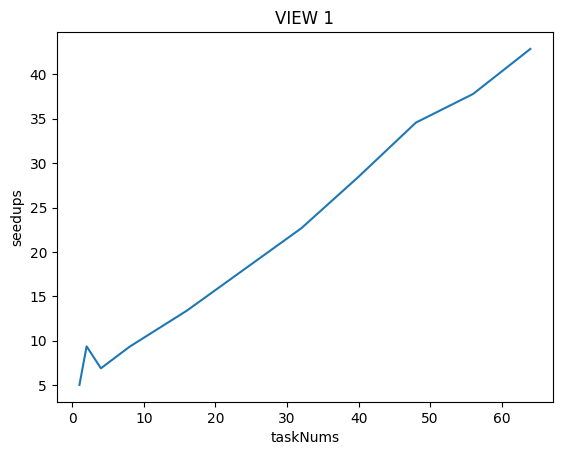
很奇怪当taskNums为4时反而比taskNums为2时的speeded还下降了!后面越提高taskNums反而speedup的上升趋势没有那么快了! 当taskNum为48时才超过32倍!
这我感觉显然有问题,可能是因为我的测试机器问题?
在原Assignment测试机中配置为:
Four Core. Each core in the processor supports two hardware threads (Intel calls this "Hyper-Threading") and the cores can execute AVX2 vector instructions which describe simultaneous execution of the same eight-wide operation on multiple single-precision data values.
在本题数据中,因为处理的数据也是float类型,所以单core可以并行处理8个数据,再加上超线程技术,可以并行处理16个数据。
设置tasknum可以调用多核(Multi-core),最多有4核,所以可以并行处理64个数据,即理论上可以达到64x的加速比!(但是实际上因为负载不均衡和超线程的本质上能力不及真正的线程的原因可能达不到64)
What are differences between the thread abstraction (used in Program 1) and the ISPC task abstraction? what happens when you launch 10,000 ISPC tasks? What happens when you launch 10,000 threads?
- multiple program instances of an ISPC program are always executed in parallel on the CPU's SIMD execution units. The number of program instances executed simultaneously is determined by the compiler
- a call from C code to an ISPC function can be thought of as spawning a group of concurrent ISPC program instances (referred to in the ISPC documentation as a gang).
- Each task defines a computation that will be executed by a gang of ISPC program instances.
引用这位老哥博客中的话:
- 线程抽象和 ISPC 任务抽象的区别类似命令式和声明式。
- 启动 10000 个线程,会实际创建这 10000 个线程运行
- 启动 10000 个任务, 这 10000 个任务组成任务池, 编译器会根据硬件情况等创建合适数量的线程,每个线程从任务池中取出任务完成。
Program 4: Iterative sqrt (15 points)
Q1:
[sqrt serial]:          [822.817] ms
[sqrt ispc]:            [188.996] ms
[sqrt task ispc]:       [9.091] ms
                                (4.35x speedup from ISPC)
                                (90.50x speedup from task ISPC)
其中很有意思的一点是讲义(handout)上说:using all cores (with tasks)., 然后在代码中开启了64个tasks
Q2
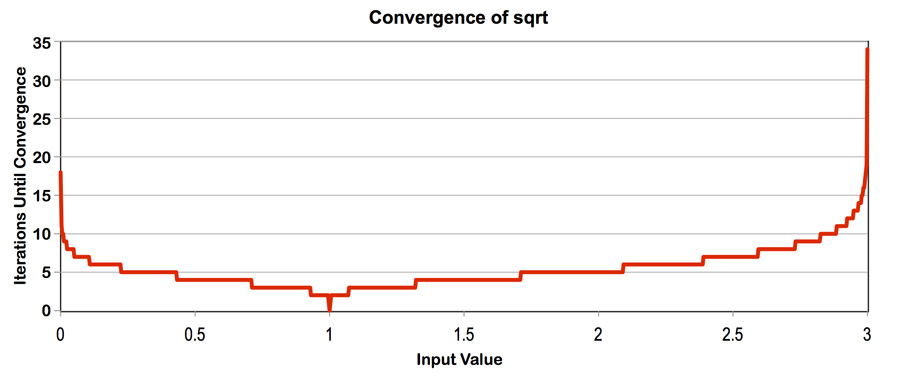
依据这张图,我们可以知道更改value[]中的值,我们可以控制负载均衡!
# 当将value[]中的值全部设置为1.f
[sqrt serial]:          [23.878] ms
[sqrt ispc]:            [12.354] ms
[sqrt task ispc]:       [1.220] ms
                                (1.93x speedup from ISPC)
                                (19.57x speedup from task ISPC)
相对加速比下降了许多!
# 当将value[]中的值全部设置为3.f
# ...好吧运行时间有亿点长, 放弃
# 当将value[]中的值全部设置为2.999f
[sqrt serial]:          [1840.285] ms
[sqrt ispc]:            [310.334] ms
[sqrt task ispc]:       [18.262] ms
                                (5.93x speedup from ISPC)
                                (100.77x speedup from task ISPC)
可以看到,不管是no task还是task,speedup都增加了!因为我这样的设置不仅照顾到了负载均衡,还提高了计算密集型!
Q3
Construct a specific input for sqrt that minimizes speedup for ISPC (without-tasks) over the sequential version of the code.
    for (unsigned int i = 0; i < N; i += 8) {
        values[i + 0] = 1.f;
        values[i + 1] = 1.5f;
        values[i + 2] = 2.f;
        values[i + 3] = 2.5f;
        values[i + 4] = 2.75f;
        values[i + 5] = 2.85f;
        values[i + 6] = 2.95f;
        values[i + 7] = 2.999f;
    }

# output:
[sqrt serial]:          [581.815] ms
[sqrt ispc]:            [310.803] ms
[sqrt task ispc]:       [13.091] ms
                                (1.87x speedup from ISPC)
                                (44.44x speedup from task ISPC)
主打的就是让负载不均衡,可以看到这里的加速比(no task)比value[]全为1还低
Program 5: BLAS saxpy (10 points)
What speedup from using ISPC with tasks do you observe? Explain the performance of this program.
[saxpy ispc]:           [17.600] ms     [16.933] GB/s   [2.273] GFLOPS
[saxpy task ispc]:      [1.740] ms      [171.313] GB/s  [22.993] GFLOPS
                                (10.12x speedup from use of tasks)
目前观察到加速度的提示并未得到预期明显的提升
Do you think it can be substantially improved?
No! 其实从输出的信息中是在给我们提示,saxpy是个I/O密集性的程序。
在我的这台机器上,频率为3.6GHZ,假设在单核上平均每周期可以进行一次MUL或一次ADD的执行,每次MUL和ADD的操作数据量为256位,那么假设在4核上运行,每秒需要的数据量为:\(4 * 256 * 3.6 * 1e9 = 460.8GB/s\),比程序测出来的171.313GB/s大很多。
即瓶颈在于内存带宽的限制,无法通过重写代码大幅改进性能。
Note that the total memory bandwidth consumed computation in main.cpp is TOTAL_BYTES = 4 * N * sizeof(float);. Even though saxpy loads one element from X, one element from Y, and writes one element to result the multiplier by 4 is correct. Why is this the case?
在计算内存带宽时,公式 TOTAL_BYTES = 4 * N * sizeof(float) 看起来与直观的 3 * N * sizeof(float)(两次读取、一次写入)不符。这种差异源于 CPU缓存的工作机制,尤其是 缓存行(Cache Line) 和 写分配(Write Allocation) 的影响。以下是详细解释:
- 缓存行大小:现代CPU的缓存行通常为 64字节(可存储
16个float,假设float为4字节)。 - 访问模式:CPU访问内存时,以缓存行为单位加载数据。即使程序只访问一个
float,实际会加载整个缓存行(64字节)。
SAXPY的计算公式为:
result[i]=scale×X[i]+Y[i]
每个元素涉及:
- 读取
X[i](4字节) - 读取
Y[i](4字节) - 写入
result[i](4字节)
表面上看,总数据量应为:3N, 但实际公式为 4N,原因如下:
写分配(Write Allocation)的额外开销
-
写分配机制:
当CPU向内存写入数据时,若目标地址不在缓存中,会先加载对应的缓存行到缓存,再修改缓存行中的值。这一过程称为写分配。- 写入
result[i]的隐含操作:- 读取
result的缓存行(64字节)到缓存。 - 修改 缓存行中的
result[i](4字节)。 - 写回 修改后的缓存行到内存(64字节)。
- 读取
- 写入
-
额外带宽开销:
写入result[i]的 4 字节数据,实际触发了 64字节的缓存行读取 和 64字节的缓存行写回。因此,每个result[i]的写入操作隐含了 128字节的内存流量(尽管只有 4 字节有效数据)。
公式 4N 反映了 每个 float 操作对应一个缓存行传输 的保守估计,考虑了最坏情况下的带宽消耗。
实际优化与例外
- 缓存命中优化:
若数组X、Y、result连续访问且适配缓存行,预取机制会减少重复加载,实际带宽可能低于4N。 - 非临时存储(Non-Temporal Store):
使用_mm_stream_ps等指令绕过缓存,直接写入内存,避免写分配开销(此时带宽接近3N)。
Program 6: Making K-Means Faster (15 points)
# 未加速的效果:
Reading data.dat...
Running K-means with: M=1000000, N=100, K=3, epsilon=0.100000
[Total Time]: 11239.540 ms
直接上perf:
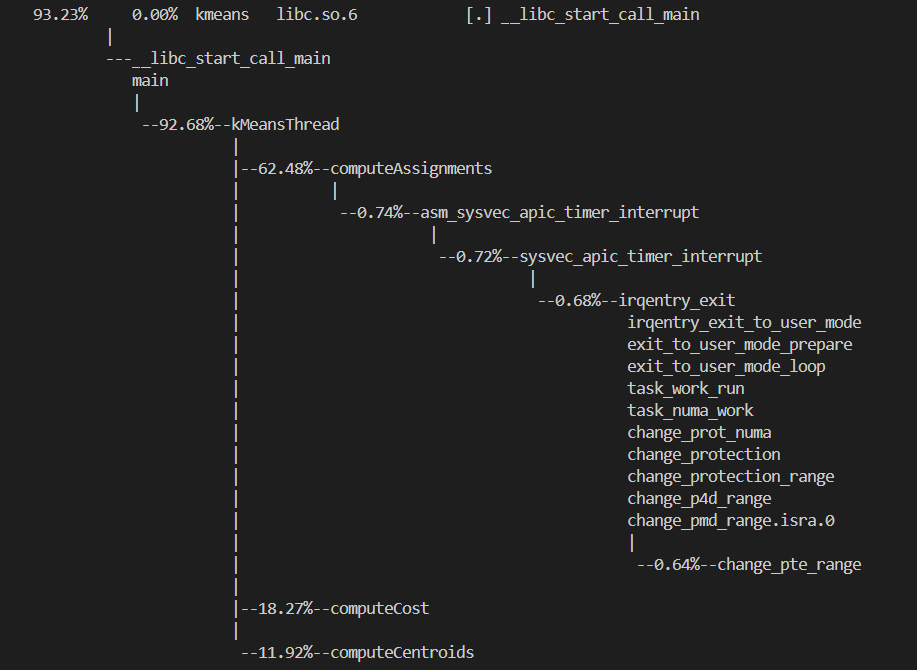
观测到函数computeAssignments耗时最大,并行优化:
# Threads = 8时
Reading data.dat...
Running K-means with: M=1000000, N=100, K=3, epsilon=0.100000
[Total Time]: 6490.518 ms
11239.540 / 6490.518 = 1.732x

# Threads = 24时
Reading data.dat...
Running K-means with: M=1000000, N=100, K=3, epsilon=0.100000
[Total Time]: 5984.791 ms
11239.540 / 5984.791 = 1.878x
...我咋感觉我这个机器算出来的平均比其他博客上的加速效果更少哇,明明方法一样...

 浙公网安备 33010602011771号