R语言:多个因变量时,如何在plot函数中画多条曲线(plot,points,lines,legend函数)
最近阅读一篇文献《Regional and individual variations in the function of the human eccrine sweat gland》,想看看里面几个变量之间的关系是怎么样,因此把文献里面的数据提取出来,
在R里面输入数据:
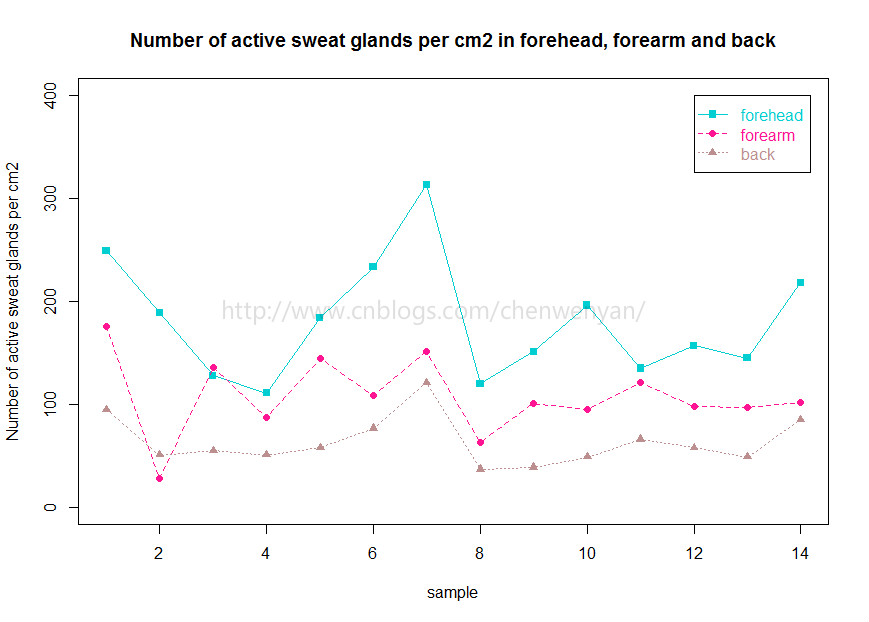
sample<-seq(1,14,by=1)
forehead<-c(249,189,128,111,184,233,313,120,151,196,135,157,145,218)
forearm<-c(176,28,136,87,145,109,151,63,101,95,121,98,97,102)
back<-c(95,51,55,51,58,77,121,37,39,49,66,58,49,85)
sweatgland<-data.frame(sample,forehead,forearm,back);sweatgland
数据如下图所示:
一共有14个样本,其中forehead,forearm,back为对应位置的数量

先画出每个样本的forehead位置的sweat gland 数量
plot(forehead~sample,pch=15,col="DarkTurquoise",ylim=c(0,400),ylab="Number of active sweat glands per cm2",main="Number of active sweat glands per cm2 in forehead, forearm and back")#pch表示散点用什么形状表示,col表示颜色,ylim表示Y轴范围,ylab表示Y轴标题,main表示图片标题
接着画出每个样本forearm位置的sweat gland 数量
注意,这里不用plot函数画forearm和sample之间的关系,因为会把上面forehead和sample的图覆盖住,为了实现多个因变量和一个自变量在同一个图片里,我们要用points或者lines函数画其他因变量和自变量的值
points(sample,forearm,pch=16,col="DeepPink",cex=1)#cex表示散点的大小
画出back位置的sweat gland 数量
points(sample,back,pch=17,col="RosyBrown",cex=1)
把14个样本在forehead,forearm和back不同位置的sweat gland 数量用线连起来
lines(forehead,col="DarkTurquoise",lty=1)#lty=1表示用实线连起来
lines(forearm,col="DeepPink",lty=2)#lty=2表示用虚线连起来
lines(back,col="RosyBrown",lty=3)#lty=3表示用点线连起来
legend函数,图例说明:
legend(12,400,c("forehead","forearm","back"),col=c("DarkTurquoise","DeepPink","RosyBrown"),text.col=c("DarkTurquoise","DeepPink","RosyBrown"),pch=c(15,16,17),lty=c(1,2,3))#12表示x轴坐标为12,400表示y轴坐标为400,意思为图例的左边和上边界限,text.col表示图例文本颜色
最后,画出来的图片效果如下:
本文来自博客园,作者:橙子牛奶糖(陈文燕),转载请注明原文链接:https://www.cnblogs.com/chenwenyan/p/6440141.html

 浙公网安备 33010602011771号