使用pptk对点云进行可视化渲染
需求
有一些3D点云,需要在三维空间进行可视化渲染,并做两组点云之间的对比。
实现
使用pptk库对点云进行渲染,可将两组点云合并传入用颜色进行区分。
import numpy as np
import pptk
# gen points
gt_points = np.random.rand(100,3)
pd_points = np.random.rand(200,3)
red = np.array([[1,0,0]])
green = np.array([[0,1,0]])
gt_colors = np.repeat(red,gt_points.shape[0],axis=0)
pd_colors = np.repeat(green,pd_points.shape[0],axis=0)
# combine points & colors
points = np.concatenate((gt_points,pd_points),axis=0)
color = np.concatenate((gt_colors,pd_colors),axis=0)
v = pptk.viewer(points,color)
v.wait()
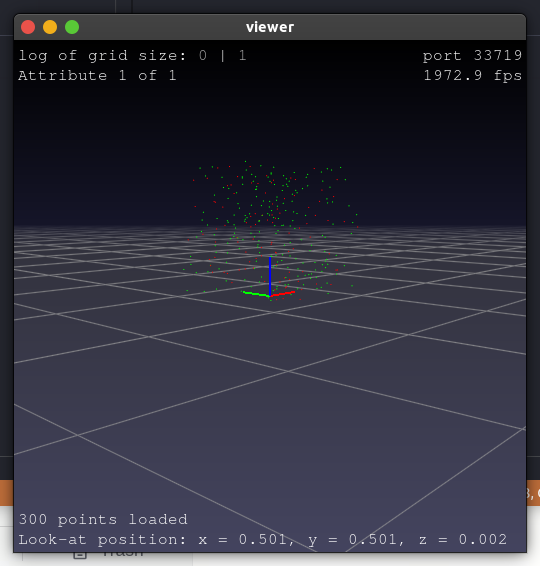
效果
注意
如果遇到pptk.viewer()卡住无法显示的情况可以参考更换依赖库的方法解决。
pptk.view() hangs without showing debug/info/error information · Issue #4 · heremaps/pptk

 浙公网安备 33010602011771号