
SciTech-Mathematics-Probability+Statistics-Causation vs. Correlation: From Correlation to Causation: Deep Dive into Data Interpretation
https://www.statology.org/from-correlation-to-causation-deep-dive-into-data-interpretation/
From Correlation to Causation: Deep Dive into Data Interpretation
Correlation and Causation are key concepts in data analysis.
However, correlation doesn't mean causation.
For example:
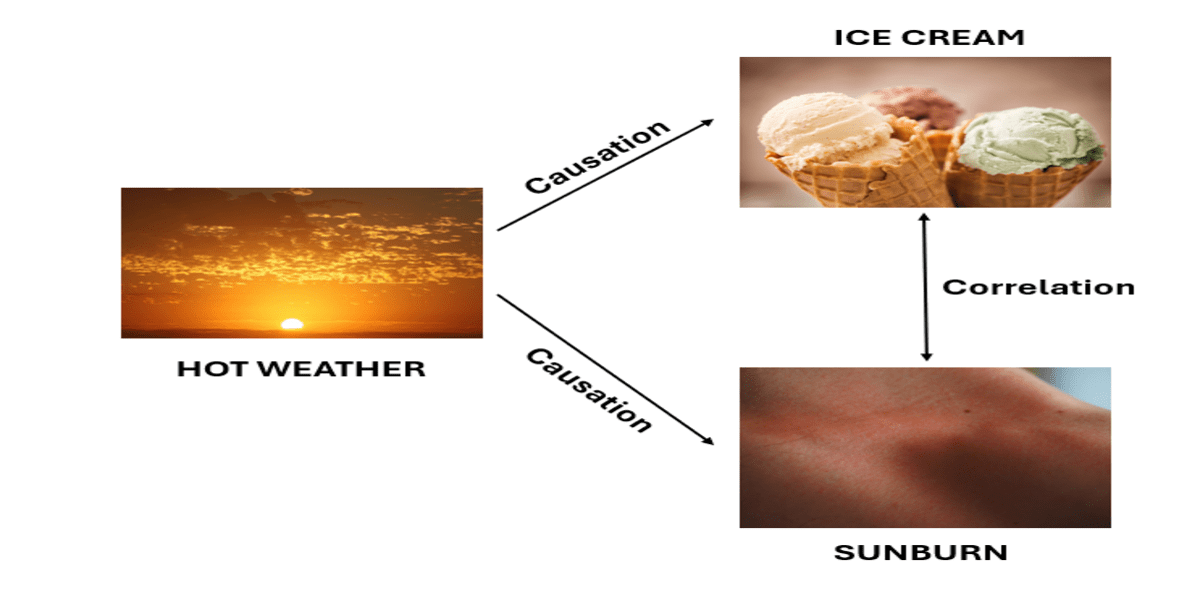
- "ice cream sales" and "sunburns" increase in the summer.
- These events happen together but do not cause each other.
They occur together because of a third factor: hot weather. - Illustration explains:
![]()
In this article, we will learn more about correlation and causation. We will also understand how these terms are different from each other.
Summary
- Correlation means two things HAPPEN TOGETHER.
- Causation means ONE thing MAKES ANOTHER thing HAPPEN.
- Correlation doesn't necessarily imply causation.
Just because two things happen together, doesn't mean that one causes the other.
It is essential to understand this distinction for accurate data analysis.
Causation vs. Correlation:
"Correlation" does not mean one variable causes the other to change.
It only shows that they change together.
Influence of Outliers: Outliers can change the correlation a lot. They can make the relationship stronger or weaker than it really is. Special methods can help reduce the impact of outliers.
Why Correlation Doesn't Imply Causation
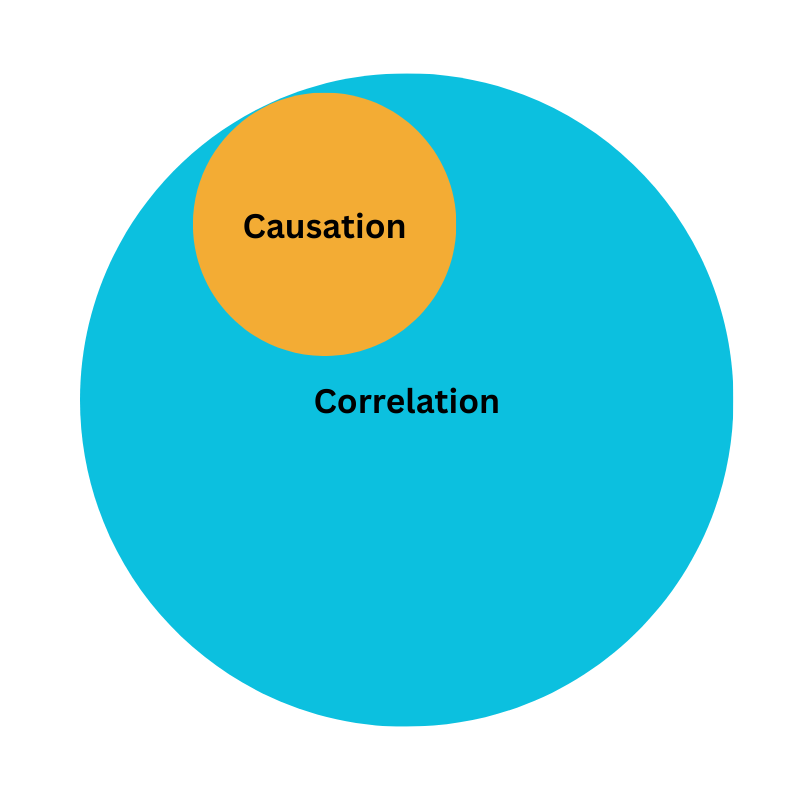
Correlation does not always mean causation.
Causation usually mean correlation.
The Venn diagram shows the overlap between them.
Let’s explore why spurious correlations happen:
- Third Variables (Confounding Factors):
Sometimes two things appear to have a connection, but in fact have one because of something that has an impact on both.
For example, umbrella sales and ice cream sales might increase together because of hot weather, not because people eat ice cream when it rains. - Reverse Causation:
Correlation doesn't show which way the causation goes.
Two things might seem linked, but one could cause the other or the other way around.
For instance, exercise and weight loss are correlated, but weight loss also makes people exercise more. - Random Chance (Coincidence):
Sometimes things look connected just by luck.
This can lead to wrong ideas about causation if we assume cause and effect based only on correlation.
Causation
Causation refers to a cause-and-effect relationship between variableS.
It means that changes in one variable cause changes in another variable.
Key Principles of Causation
- Temporal Precedence:
The cause MUST happen before the effect.
This helps us understand which one comes first and shows us the direction of cause and effect. - Covariation:
Changes in the cause SHOULD always be followed by changes in the effect.
Methods like long-term studies can prove this connection over time. - Controlling for Confounding Factors:
It's important to find other factors that COULD affect the relationship between variables.
Methods like statistical controls and random selection can reduce the impact of these factors.
Establishing Causation
To establish causation, researchers often use experimental designs.
They change the independent variable and observe changes in the dependent variable.
Key methods include:
- Randomized Controlled Trials (RCTs):
These experiments randomly assign participants to different groups.
One variable is changed, and other variables constant are kept constant. - Longitudinal Studies:
These studies track variables for a long period of time.
It examines how changes in one variable(independent variable) relate to changes in another variable(dependent variable). - Challenges and Considerations
- Ethical Constraints: Some experiments that establish causation may be unethical to conduct.
- Complexity: It is difficult to establish causation due to the presence of multiple variables and interactions among them.
Correlation
Correlation is a statistical measure used to assess the relationship between two variables.
We can understand how changes in one variable are associated with changes in another.
Limitations of Correlation: "Linear Relationships Only"
- Correlation measures only straight-line relationships.
- It doesn't work for curved or irregular ones.
Types of Correlation
There are three main types of correlation:
- Positive Correlation: When both variables move in the same direction (e.g., as one variable increases, the other also increases).
- Negative Correlation: When variables move in opposite directions (e.g., as one variable increases, the other decreases).
- No Correlation: When there is no discernible relationship between the variables.
Measuring Correlation
Correlation is MEASURED USING a correlation coefficient, typically denoted as 𝑟.
The value of 𝑟 ranges from -1 to 1.
- 𝑟=1: Perfect positive correlation;
as one variable increases, the other also increases proportionally. - 𝑟=−1: Perfect negative correlation;
as one variable increases, the other decreases proportionally. - 𝑟=0: No correlation;
there is no linear relationship between the variables.
The relationship is stronger if 𝑟 is close to +1 or -1.
A correlation coefficient 𝑟 near 0 refers to a weak or no linear relationship.
Interpreting Correlation
Strength of Relationship:
The correlation coefficient ranges from -1 to 1.
- A correlation coefficient close to +1 indicates a strong positive relationship.
It means as one variable increases, the other also increases. - A coefficient close to -1 indicates a strong negative relationship.
When one variable increases, the other tends to decrease. - A coefficient close to 0 suggests a weak or no relationship between the variables.
Direction of Relationship:
The sign of the correlation coefficient (+ or -) indicates the direction of the relationship.
**A positive r indicates a positive relationship (both variables move in the same direction).
A negative r indicates a negative relationship (both variables move in opposite directions).

 浙公网安备 33010602011771号