
BigdataAIML-Important Data Features preprocessing points非常重要的数据维度预处理方面
https://developer.ibm.com/tutorials/awb-k-means-clustering-in-python/
PCA: 对2D数据非常好理解,但是对tensor(3D以上维度),假设维度为N,
可以理解为 求一个 方阵, 每一条N维列向量的数据乘以这个方阵(即进行多维坐标轴旋转),
得到的是降维变换(小于等于N维空间的)后的向量;
算法会有一些前提条件与假设,而通过数据预处理,
不仅可以保障与满足这些,同时能提高模型的有效计算速度。
“不空”、“不漏”、“不乱”、“不限”、“不差”、“不异”:
- Dedkind Split
- 不限、不差、不异
例如:- 大多数算法假设数据是完整而有效的。
- Naive-Bayes算法假设数据维度之间的correlationship是非常小的。
- K-Means算法要估计最佳的Number of Cluster簇数。
Preprocessing
-
Ensure that the columns were imported with the correct data types.
$ print(df.dtypes)
distance_center float64
num_rooms float64
property_size float64
age float64
utility_cost float64
label int64
dtype: object -
Check for missing values.
Consider imputation or removing missing values if there are many.
$ df.isnull().sum()
distance_center 0
num_rooms 0
property_size 0
age 0
utility_cost 0
label 0
dtype: int64 -
Check for outliers.
Consider removing outliers If appropriate, so that the final cluster shapes are not skewed. -
Standardize scales first using scikit-learn;
-
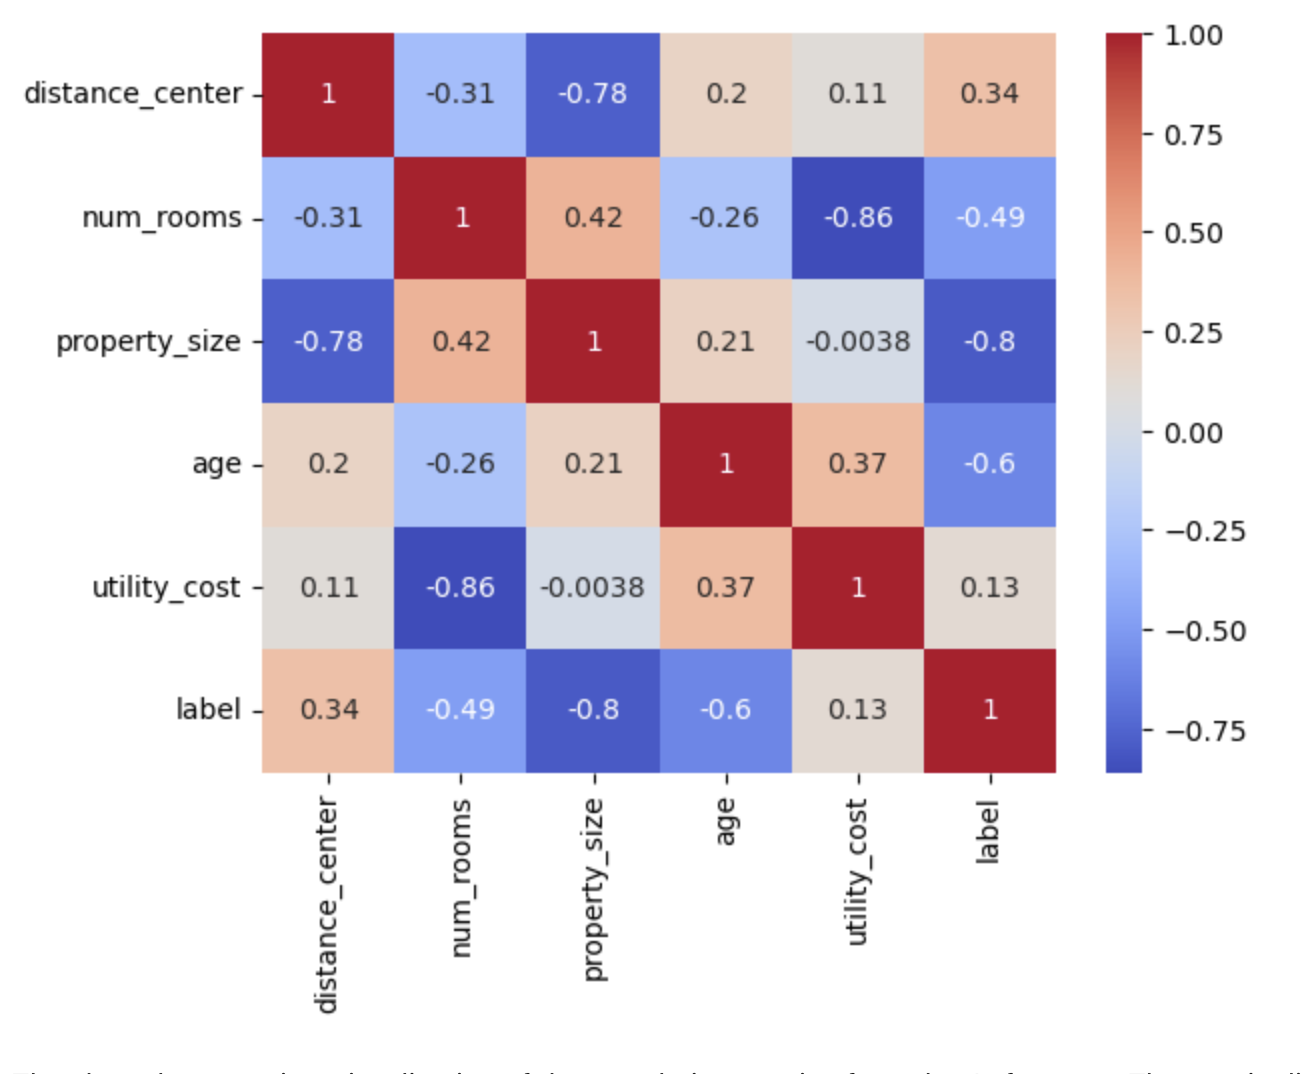
Identify correlated features using mathematics(Measure of correlationship);
Consider using a pairwise plot to identify strong correlations and remove features that are highly correlated.
![]()
EDA(Exploratory Data Analysis)
These are the steps you will follow:
- Create a AI project and open a Jupyter Notebook.
- Generate a data set and do preprocess.
- Perform EDA (exploratory data analysis).
- Choose K clusters using WCSS.
- Interpret K-means clustering.
Example: Choose best K for K-Means model
When EDA is complete, you must choose how many clusters to separate your data into.
- set K manually in scikit-learn If you already know how many groups you want to make.
- use the elbow method to test different K values, If you are not sure how many groups are appropriate,
- The elbow method works by computing the Within Cluster Sum of Squares (WCSS), quantifies the variance (or spread) of data within a cluster.
- If WCSS decreases, the data within the clusters are more similar.
- As K increases, there should be a natural decrease in WCSS because the distance between the data in its cluster to its center will be smaller.
- The ideal K is the "elbow" point of the graph, where WCSS stops decreasing or starts to marginally decrease as K increases.
- The elbow method is particularly useful for big data sets that have lots of potential clusters because there is a trade-off between computational power required to run the algorithm and the number of clusters generated.
Use the following steps to implement the elbow method.
- Create an empty list to hold WCSS values at different K values.
- Fit the clusters with different K values.
- At each K value, append the WCSS value to the list.
- Graph the WCSS values versus the number of clusters.
Use the elbow method to find a good number of clusters using WCSS (within-cluster sums of squares)
wcss = []
Let's check for up to 10 clusters
for i in range(1, 11):
kmeans = KMeans(n_clusters=i, init='k-means++', max_iter=300, n_init=10, random_state=42)
kmeans.fit(df)
wcss.append(kmeans.inertia_)
plt.plot(range(1, 11), wcss)
plt.title('Elbow Method')
plt.xlabel('Number of clusters')
plt.ylabel('WCSS')
plt.show()
Select the "elbow point" of the graph as your K value.
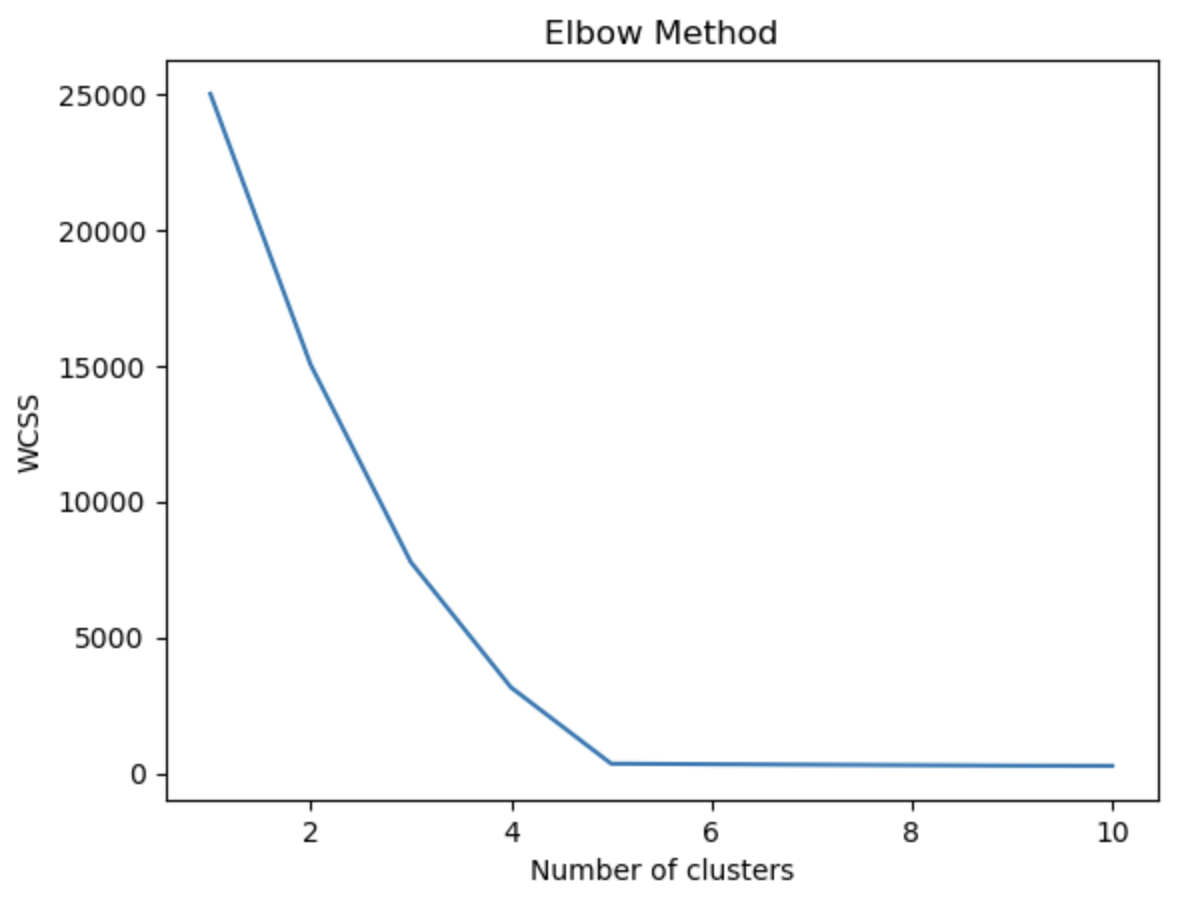
Elbow method graph
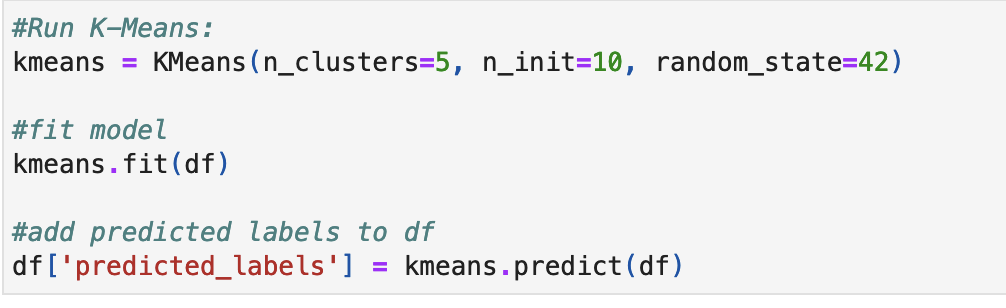
Rerun K-means with your chosen K value. Use the n_clusters parameter to set the K value.
Be sure to set the random_state parameter for reproducibility.
The graph indicates that 5 is the ideal number of clusters, which makes sense because we set the make-blobs number of centers parameter equal to 5.
Ideal number of clusters
Step 5. Interpret K-means clustering
**Using PCA(Principal Component Analysis) and similar dimensionality reduction technique
so you can graph your clusters in a two-dimensional space and visualize the groupings.
This tutorial does not cover the exact details of PCA,
but our data has five dimensions, and thus dimensionality reduction is needed to visualize clusters of data with more than two dimensions in a 2-D space.
It's likely that most data sets that you encounter when performing K-means clustering have data with more than two dimensions.
The following steps are the high-level steps to interpret K-means clustering.

 浙公网安备 33010602011771号