随笔分类 - Echarts
1
摘要:效果预览 代码 echarts option配置中的series写法如下: series:[ { type: 'custom', coordinateSystem: 'bmap', renderItem: (params, api) => renderPolygon(params, api, gAr
阅读全文
摘要:实现效果 代码如下: import pump from '@/gis/assets/image/pump.png'; series: [ { type: 'lines', coordinateSystem: 'bmap', markPoint: { // symbol: `image://${pum
阅读全文
摘要:设置bmap最大最小可缩放级别,代码如下: myChart.on('bmaproam', () => { var bmap = myChart.getModel().getComponent('bmap').getBMap(); // 设置最小缩放值 bmap.setMinZoom(14); bma
阅读全文
摘要:显示不完整是这样的 预期结果是这样的 代码 dataZoom: [{ show: true, xAxisIndex: [0, 1], type: "slider", top: "72%", // 文本换行是在这里处理 // this.chartData.xdata[value] 的格式是这样的 "2
阅读全文
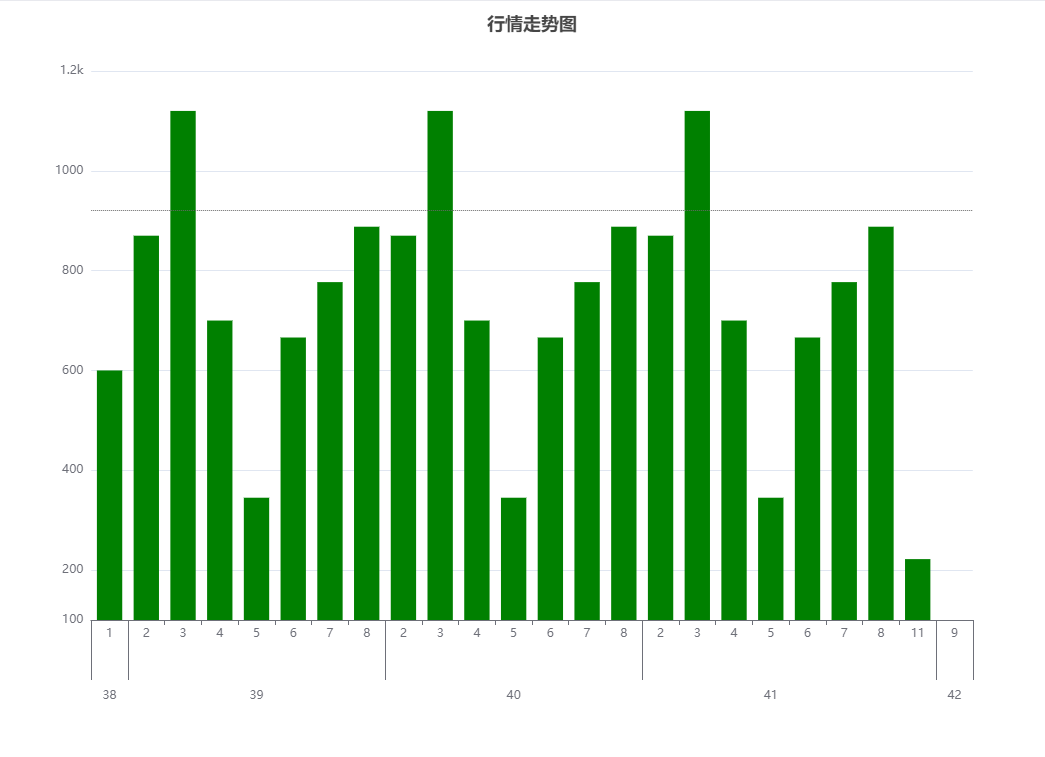
摘要: ``` option = { title: { text: '行情走势图', x: 'center', alig
阅读全文
摘要:[madeapie](https://madeapie.com/#/) [MCChart](http://echarts.zhangmuchen.top/#/index) [ppchart](http://ppchart.com/#/) [makeapie](https://www.makeapie
阅读全文
摘要:## 问题 当图表中的 legend 过多的时候,就需要考虑 legend 进行换行,但是换行之后,图例就会无法对齐。 ## 解决 ``` legend: { icon: "rect", width: "80%", itemWidth: 6, itemHeight: 6, bottom: 0, te
阅读全文
摘要:## 问题 今天 echarts 版本更新至5.1.2,发现鼠标悬停在折线图上,折线变粗,这个效果和我的需求相悖,所以想办法去掉此效果 ## 解决 **emphasis** :折线图的高亮状态。 **设置emphasis.lineStyle和折线图本身lineStyle相同即可** ``` let
阅读全文
摘要:## 问题 微信小程序项目中,使用了ec-canvas绘制图表,在开发者工具中预览正常,但是在真机上点击图表tooltip会出现一层阴影,如下图所示:  => { chart = echarts
阅读全文
摘要:实现效果: 代码: const option = { // 环形图中间文字 title: { text: '1200', subtext: '总户数', textStyle: { fontSize: 16, color: '#333', fontWeight: 600, }, subtextStyl
阅读全文
摘要:echarts作为我们前端小伙伴常用的可视化库,那我们画出有阴影的折线图,让折线图比较立体感。 可以使用折线图的 lineStyle 实现效果如图 代码如下: series: [ { data: [150, 230, 224, 218, 135, 147, 260], type: "line", s
阅读全文
摘要:实现效果: 重点: 在lengend属性中 data 中设置icon { name: 'Target', icon: 'path://m0.010277,5.945418l24.979446,0l0,2.109164l-24.979446,0l0,-2.109164z' } 代码: option =
阅读全文
摘要:y轴垂直翻转 实现效果: 设置 inverse: true 即可,代码如下: option = { xAxis: { type: 'category', data: ['Mon', 'Tue', 'Wed', 'Thu', 'Fri', 'Sat', 'Sun'] }, yAxis: { type:
阅读全文
摘要:当X轴数据过多时Echarts会默认显示一半 如下图: Echarts加入axisLabel然后将interval设置为0就会将横轴全部显示 xAxis: [{ type: 'category', boundaryGap: 0, axisLine: { show: false, lineStyle:
阅读全文
摘要:需求: echarts中的tooltip提示框需要拼接单位,效果如下: 代码: tooltip: { trigger: 'axis', formatter: (params) => { // unit 为单位,此处是需要动态拼接单位 const unitStr = unit ? `(${unit})
阅读全文
摘要:问题: 项目中用到echrts图表,在本地调试没有问题,刷新浏览器,echarts均可正常显示。 但是发布到线上后,从tab切换页面echarts可正常显示,在当前页刷新浏览器后echarts会空白,并且控制台无报错。 解决: 原因是当刷新浏览器时,echartsData改变后window.echa
阅读全文
摘要:##问题: data=[ { value: [ "1997-10-1", 684 ] }, { value: [ "1997-10-2", 200 ] }, { value: [ "1997-10-15", 300 ] }] option = { xAxis: { type: 'category'
阅读全文
摘要:dataZoom 组件 用于区域缩放,先上手柄效果图:长方形和圆形的效果: 先将 handleIcon 的具体数值贴出来: dataZoom: [ { id: "dataZoomX", type: "slider", backgroundColor: "#F2F5F9", fillerColor:
阅读全文
摘要:如图 将Y轴 设置为固定的0% 20% 100% yAxis: { type: 'value', max: 100,//最大值 min: 0,//最小值 interval:20,//间隔 axisLine:{ show: false, lineStyle:{ color:'#d9e1e4' }, }
阅读全文
1

 浙公网安备 33010602011771号