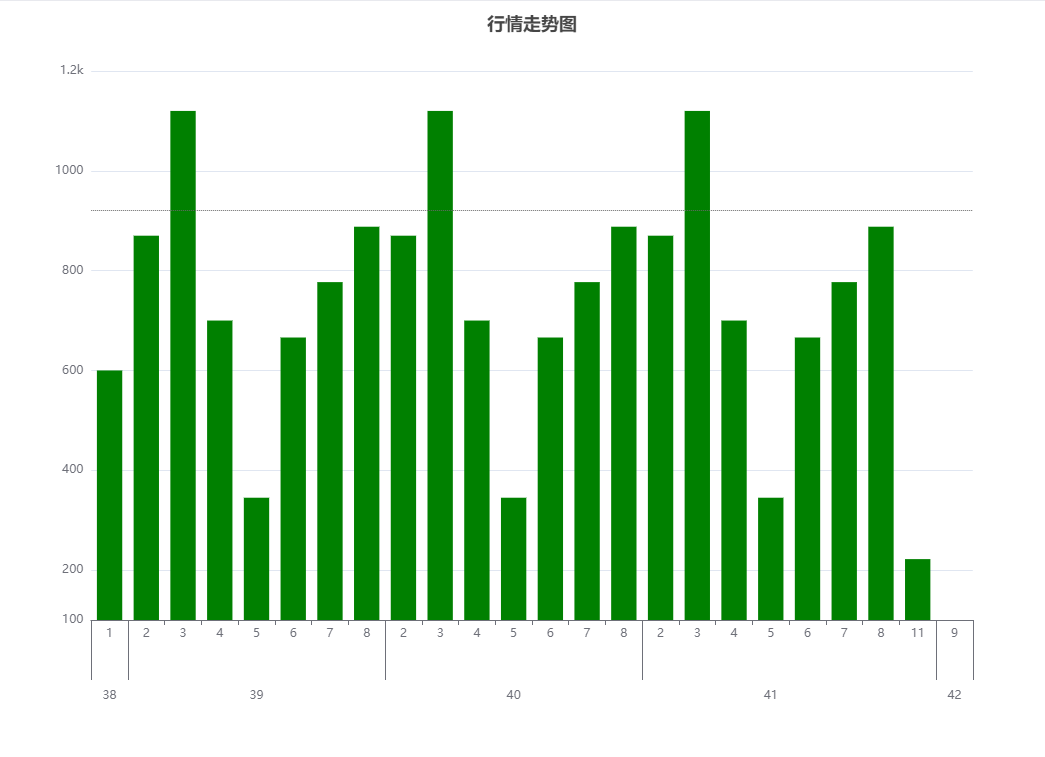
option = {
  title: {
    text: '行情走势图',
    x: 'center',
    align: 'right'
  },
  grid: {
    bottom: 160
  },
  tooltip: {
    trigger: 'axis',
    axisPointer: {
      animation: false
    }
  },
  dataZoom: [
    {
      show: false,
      realtime: false
    }
  ],

  xAxis: [
    {
      type: 'category',
      position: 'bottom',
      axisLine: {
        show: true
      },
      data: [
        '1',
        '2',
        '3',
        '4',
        '5',
        '6',
        '7',
        '8',
        '2',
        '3',
        '4',
        '5',
        '6',
        '7',
        '8',
        '2',
        '3',
        '4',
        '5',
        '6',
        '7',
        '8',
        '11',
        '9'
      ]
    },
    {
      type: 'category',
      position: 'bottom',
      data: [
        '38',
        '39',
        '39',
        '39',
        '39',
        '39',
        '39',
        '39',
        '40',
        '40',
        '40',
        '40',
        '40',
        '40',
        '40',
        '41',
        '41',
        '41',
        '41',
        '41',
        '41',
        '41',
        '41',
        '42'
      ],
      axisLabel: {
        margin: 70,
        align: 'center',
        show: true,
        interval: function (index, value) {
          let indexData2 = [
            true,
            false,
            false,
            false,
            true,
            false,
            false,
            false,
            false,
            false,
            false,
            true,
            false,
            false,
            false,
            false,
            false,
            false,
            true,
            false,
            false,
            false,
            false,
            true
          ];
          if (indexData2[index]) {
            return value;
          }
        }
      },
      axisLine: {
        lineStyle: {
          width: 1
        }
      },
      axisTick: {
        interval: function (index, value) {
          let indexData = [
            true,
            true,
            false,
            false,
            false,
            false,
            false,
            false,
            true,
            false,
            false,
            false,
            false,
            false,
            false,
            true,
            false,
            false,
            false,
            false,
            false,
            false,
            false,
            true
          ];
          if (indexData[index]) {
            return value;
          }
        },
        length: 60
      }
    }
  ],
  yAxis: [
    {
      type: 'value',
      min: 100,
      axisLine: {
        show: false
      },
      axisTick: {
        show: false
      },
      axisLabel: {
        formatter: function (value, index) {
          return value > 1000 ? value / 1000 + 'k' : value;
        }
      },
      splitLine: {
        show: true
      }
    }
  ],
  series: [
    {
      name: '模拟数据',
      type: 'bar',
      smooth: true,
      symbol: 'none',
      sampling: 'average',
      itemStyle: {
        normal: {
          color: 'green'
        }
      },
      markLine: {
        silent: true,
        animation: false,
        symbol: '',
        label: {
          normal: {
            show: false
          }
        },
        lineStyle: {
          normal: {
            color: '#666',
            type: 'dotted'
          }
        },
        data: [
          {
            yAxis: 920
          }
        ]
      },
      data: [
        600, 870, 1120, 700, 345, 666, 777, 888, 870, 1120, 700, 345, 666, 777,
        888, 870, 1120, 700, 345, 666, 777, 888, 222
      ]
    }
  ]
};


 浙公网安备 33010602011771号