
跟着jmzeng学习GEO数据分析-GEO42872_1
f='GSE42872_eSet.Rdata'  ##原文操作如此,是不是作者的习惯,先命名
# https://www.ncbi.nlm.nih.gov/geo/query/acc.cgi?acc=GSE42872
library(GEOquery)
# 这个包需要注意两个配置,一般来说自动化的配置是足够的。
#Setting options('download.file.method.GEOquery'='auto')
#Setting options('GEOquery.inmemory.gpl'=FALSE)
##因为安装包的问题我把Rstudio关了,所以这里getGEO从本地读取文件
##gset <- getGEO(filename = "GSE42872_series_matrix.txt.gz")
##问题出来了,用getGEO
> gset_42872 <- getGEO(filename = "GSE42872_series_matrix.txt.gz")
Parsed with column specification:
cols(
  ID_REF = col_double(),
  GSM1052615 = col_double(),
  GSM1052616 = col_double(),
  GSM1052617 = col_double(),
  GSM1052618 = col_double(),
  GSM1052619 = col_double(),
  GSM1052620 = col_double()
)
|===================================================================| 100%    1 MB
Using locally cached version of GPL6244 found here:
C:\Users\Mark\AppData\Local\Temp\RtmpM1jsvM/GPL6244.soft
> class(gset_42872)  ##得到的gset_42872等同于下面程序中的对象a,是ExpressionSet类型,而不是原文中的list类型???
[1] "ExpressionSet"
attr(,"package")
[1] "Biobase"
##当本地存在GSE42872...gz这个文件时,getGEO会从本地读取。
> gset <- getGEO("GSE42872",destdir = ".",AnnotGPL = F,getGPL = F)
Found 1 file(s)
GSE42872_series_matrix.txt.gz
Using locally cached version: ./GSE42872_series_matrix.txt.gz
if(!file.exists(f)){
  gset <- getGEO('GSE42872', destdir=".",
                 AnnotGPL = F,     ## 注释文件
                 getGPL = F)       ## 平台文件
  save(gset,file=f)   ## 保存到本地
}
load('GSE42872_eSet.Rdata')  ## 载入数据--载入数据干嘛?从后面看似乎并没有用到这个。
class(gset)
> class(gset)
[1] "list"
length(gset)
class(gset[[1]])  ##既然gset是个list,gset[[1]]表示访问其第一个元素本身。返回的是ExpressionSet类型
> class(gset[[1]])
[1] "ExpressionSet"
attr(,"package")
[1] "Biobase"
gset
> gset
$GSE42872_series_matrix.txt.gz     ##列表以$符号开头
ExpressionSet (storageMode: lockedEnvironment)
assayData: 33297 features, 6 samples
  element names: exprs
protocolData: none
phenoData
  sampleNames: GSM1052615 GSM1052616 ... GSM1052620 (6 total)
  varLabels: title geo_accession ... cell type:ch1 (34 total)
  varMetadata: labelDescription
featureData: none
experimentData: use 'experimentData(object)'
  pubMedIds: 24469106
Annotation: GPL6244
# 因为这个GEO数据集只有一个GPL平台,所以下载到的是一个含有一个元素的list--所以有几个注释的GPL平台,该list就有几个元素是吗?
a=gset[[1]] #gset[[1]]取第一个元素本身
dat=exprs(a) #a现在是一个对象,取a这个对象通过看说明书知道要用exprs这个函数  怎么看出来啊??还有exprs()是什么函数?
dim(dat)#看一下dat这个矩阵的维度
> a  = gset[[1]]
> class(a)
[1] "ExpressionSet"
attr(,"package")
[1] "Biobase"
> dat = exprs(a)
> class(dat)
[1] "matrix" "array"
> dim(dat)  ##33697行 6列
[1] 33297     6
> head(dat)
        GSM1052615 GSM1052616 GSM1052617 GSM1052618 GSM1052619 GSM1052620
7892501    7.24559    6.80686    7.73301    6.18961    7.05335    7.20371
7892502    6.82711    6.70157    7.02471    6.20493    6.76554    6.24252
7892503    4.39977    4.50781    4.88250    4.36295    4.18137    4.73492
7892504    9.48025    9.67952    9.63074    9.69200    9.91324    9.65897
7892505    4.54734    4.45247    5.11753    4.87307    5.15505    3.99340
7892506    6.80701    6.90597    6.72472    6.77028    6.77058    6.77685
# GPL6244
dat[1:4,1:4] #查看dat这个矩阵的1至4行和1至4列,逗号前为行,逗号后为列
boxplot(dat,las=2) ##boxplot()表示画箱线图,类似K线。las = 2好像表示横轴label与横轴垂直,las=1表示平行
![]()

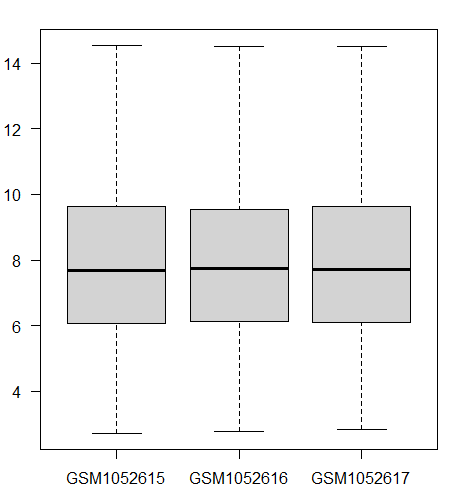
> boxplot(dat[,1:3],las = 1 )
![]()
pd=pData(a) #通过查看说明书知道取对象a里的临床信息用pData?怎么看出来的啊?
> pd = pData(a)
> class(pd)
[1] "data.frame"
> dim(pd)
[1]  6 34
> head(pd[,c(1,34)],n =2)
                                 title      cell type:ch1
GSM1052615 A375 cells 24h Control rep1 Melanoma cell line
GSM1052616 A375 cells 24h Control rep2 Melanoma cell line
## 挑选一些感兴趣的临床表型。如何挑?
library(stringr)
group_list=str_split(pd$title,' ',simplify = T)[,4]  ##单引号中间是有个空格的!表示以空格将取出的title这一列分隔开,然后取第四列
table(group_list)
> library(stringr)
> group_list = str_split(pd$title," ",simplify = T)[,4]
> class(group_list)
[1] "character"
> group_list
[1] "Control"     "Control"     "Control"     "Vemurafenib" "Vemurafenib"
[6] "Vemurafenib"
> table(group_list)
group_list
    Control Vemurafenib
          3           3
> x = str_split(pd$title," ",simplify  = T)  ##看看str_split()之后得到的到底是个啥,simplify = T,返回的是一个6行5列的字符矩阵。
> class(x)
[1] "matrix" "array"
> dim(x)
[1] 6 5
> x
     [,1]   [,2]    [,3]  [,4]          [,5]
[1,] "A375" "cells" "24h" "Control"     "rep1"
[2,] "A375" "cells" "24h" "Control"     "rep2"
[3,] "A375" "cells" "24h" "Control"     "rep3"
[4,] "A375" "cells" "24h" "Vemurafenib" "rep1"
[5,] "A375" "cells" "24h" "Vemurafenib" "rep2"
[6,] "A375" "cells" "24h" "Vemurafenib" "rep3"
> dim(pd) ##pd是个6行34列的数据框,
[1]  6 34
这里关于str_split(),simplify = F,默认情况下,返回的是含有6个元素-每个元素都是一个字符向量的的列表
> x = str_split(pd$title," ",simplify  = F)
> x
[[1]]
[1] "A375"    "cells"   "24h"     "Control" "rep1"

[[2]]
[1] "A375"    "cells"   "24h"     "Control" "rep2"

[[3]]
[1] "A375"    "cells"   "24h"     "Control" "rep3"

[[4]]
[1] "A375"        "cells"       "24h"         "Vemurafenib" "rep1"

[[5]]
[1] "A375"        "cells"       "24h"         "Vemurafenib" "rep2"

[[6]]
[1] "A375"        "cells"       "24h"         "Vemurafenib" "rep3"
dat[1:4,1:4]

# GPL6244

if(F){  ##这里的if(F)应该是不对的吧,if(T)才能运行后面的一大堆呀
  library(GEOquery)
  #Download GPL file, put it in the current directory, and load it:
  gpl <- getGEO('GPL6244', destdir=".")
  colnames(Table(gpl))
  head(Table(gpl)[,c(1,15)]) ## you need to check this , which column do you need
  probe2gene=Table(gpl)[,c(1,15)]
  head(probe2gene)
  library(stringr)
  save(probe2gene,file='probe2gene.Rdata')
}
#
# load(file='probe2gene.Rdata')
# ids=probe2gene
> colnames(Table(gpl))
 [1] "ID"              "GB_LIST"         "SPOT_ID"
 [4] "seqname"         "RANGE_GB"        "RANGE_STRAND"
 [7] "RANGE_START"     "RANGE_STOP"      "total_probes"
[10] "gene_assignment" "mrna_assignment" "category"
> class(Table(gpl))
[1] "data.frame"
> ls()
[1] "a"          "dat"        "f"          "gpl"        "group_list"
[6] "gset"       "pd"         "x"
> y <- Table(gpl) ##y似乎没有被用到
> dim(y)  ##12列
[1] 6428   12
> colnames(Table(gpl))
 [1] "ID"              "GB_LIST"         "SPOT_ID"
 [4] "seqname"         "RANGE_GB"        "RANGE_STRAND"
 [7] "RANGE_START"     "RANGE_STOP"      "total_probes"
[10] "gene_assignment" "mrna_assignment" "category"
> head(Table(gpl)[,c(1,15)])  ##只有12列
Error in `[.data.frame`(Table(gpl), , c(1, 15)) :
  undefined columns selected
> head(Table(gpl)[,c(1,12)]) ##原文这里都是15,查看NCBI GEO数据框原始的GPL6244,只有12列。我猜这里是要取第一和最后一列,就自取c(1,12)了
       ID category
1 7896736     main
2 7896738     main
3 7896740     main
4 7896742     main
5 7896744     main
6 7896746     main
> probe2gene = Table(gpl)[,c(1,12)]
> head(probe2gene)
       ID category
1 7896736     main
2 7896738     main
3 7896740     main
4 7896742     main
5 7896744     main
6 7896746     main
> library(stringr)
> save(probe2gene,file = "probe2gene.Rdata")
library(hugene10sttranscriptcluster.db)
ids=toTable(hugene10sttranscriptclusterSYMBOL) #toTable这个函数:通过看hgu133plus2.db这个包的说明书知道提取probe_id(探针名)和symbol(基因名)的对应关系的表达矩阵的函数为toTable
head(ids) #head为查看前六行
> library(hugene10sttranscriptcluster.db)  ##这个包直接搜名字,然后在是Bioconductor的包
> ids = toTable(hugene10sttranscriptclusterSYMBOL)
> class(ids) ##习惯性查看创建的对象类型
[1] "data.frame"
> dim(ids)  ##然后如果是数据框、矩阵就看行列数,懒得用nrow()和ncol()了
[1] 19814     2
>  head(ids)   ##这里看出这个ids是探针ID和symbol(基因名)一一对应的一个列表
  probe_id    symbol
1  7896759 LINC01128
2  7896761    SAMD11
3  7896779    KLHL17
4  7896798   PLEKHN1
5  7896817     ISG15
6  7896822      AGRN
colnames(ids)=c('probe_id','symbol')
ids=ids[ids$symbol != '',]
> colnames(ids) = c("probe_id","symbol") ##很奇怪ids的列名本来就是probe_id symbol,为啥这里有重新赋值一次
> ids = ids[ids$symbol != "",]  ##原文引号内应该是空字符,这里取原ids的symbol不为空的行,重新赋值给ids
> dim(ids)
[1] 19814     2
> head(ids)
  probe_id    symbol
1  7896759 LINC01128
2  7896761    SAMD11
3  7896779    KLHL17
4  7896798   PLEKHN1
5  7896817     ISG15
6  7896822      AGRN
ids=ids[ids$probe_id %in% rownames(dat),]
> ids = ids[ids$probe_id %in% rownames(dat),]  ##应该把probe_id这一列与dat行名一致的行取出来,再赋值给ids。那不一致的行呢?
> dat = dat[ids$probe_id,]  ##然后用上面一致的行名在dat中挑一遍,再赋值给dat
> dim(ids)
[1] 19814     2
> dim(dat)  ##dat原来是33297列,现在列数与ids相同
[1] 19814     6
dat[1:4,1:4]
dat=dat[ids$probe_id,]

ids$median=apply(dat,1,median) #ids新建median这一列,列名为median,同时对dat这个矩阵按行操作,取每一行的中位数,将结果给到median这一列的每一行
> ids$median = apply(dat,1,median) ##apply()求dat每行的median,1表示每行
> head(ids, n= 3)
  probe_id    symbol   median
1  7896759 LINC01128 8.534290
2  7896761    SAMD11 8.814165
3  7896779    KLHL17 8.172010
ids=ids[order(ids$symbol,ids$median,decreasing = T),]#对ids$symbol按照ids$median中位数从大到小排列的顺序排序,将对应的行赋值为一个新的ids
> ids  = ids[order(ids$symbol,ids$median,decreasing = T),]  ##order()默认返回按升序排列的索引值
> head(ids,n = 3)
      probe_id symbol   median
1397   7917103   ZZZ3 11.37165
7922   8011542  ZZEF1  9.79119
16662  8136918    ZYX 10.85015
> head(ids,n = 6)    ##似乎并不是从大到小排列,要弄明白
      probe_id symbol    median
1397   7917103   ZZZ3 11.371650
7922   8011542  ZZEF1  9.791190
16662  8136918    ZYX 10.850150
349    7901479 ZYG11B 10.498800
350    7901497 ZYG11A  5.697845
13475  8090351   ZXDC 10.131450
> dim(ids)
[1] 19814     3
ids=ids[!duplicated(ids$symbol),]#将symbol这一列取取出重复项,'!'为否,即取出不重复的项,去除重复的gene ,保留每个基因最大表达量结果s
> ids  = ids[!duplicated(ids$symbol),]
> dim(ids)  ##列数减少了,也就是说有多个探针对应一个probe_id
[1] 18821     3
dat=dat[ids$probe_id,] #新的ids取出probe_id这一列,将dat按照取出的这一列中的每一行组成一个新的dat
rownames(dat)=ids$symbol#把ids的symbol这一列中的每一行给dat作为dat的行名
dat[1:4,1:4]  #保留每个基因ID第一次出现的信息
> dat = dat[ids$probe_id,]  ##用ids中symbol去重复之后的probe_id,再挑一次dat,组成新的dat
> dim(dat)
[1] 18821     6
> head(dat) ##可以看到,此时da的行名还是probe_id
        GSM1052615 GSM1052616 GSM1052617 GSM1052618 GSM1052619 GSM1052620
7917103   11.26970   11.12560   11.23260   11.47360   11.55680   11.47480
8011542    9.63412    9.44327    9.67075    9.96091   10.02970    9.91163
8136918   10.89980   10.93190   10.91850   10.71250   10.56110   10.80050
7901479   10.48080   10.32370   10.51680   10.74500   10.65980   10.38960
7901497    5.76104    5.89974    6.00656    5.56078    5.63465    5.56169
8090351   10.10980   10.10570   10.19240   10.24110   10.15310   10.06140
> rownames(dat) = ids$symbol  ##可以直接这样的原因在于用dat[ids$probe_id,]得到新的dat之后,行名顺序与ids的probe_id列的是一样的
> head(dat)  ###
       GSM1052615 GSM1052616 GSM1052617 GSM1052618 GSM1052619 GSM1052620
ZZZ3     11.26970   11.12560   11.23260   11.47360   11.55680   11.47480
ZZEF1     9.63412    9.44327    9.67075    9.96091   10.02970    9.91163
ZYX      10.89980   10.93190   10.91850   10.71250   10.56110   10.80050
ZYG11B   10.48080   10.32370   10.51680   10.74500   10.65980   10.38960
ZYG11A    5.76104    5.89974    6.00656    5.56078    5.63465    5.56169
ZXDC     10.10980   10.10570   10.19240   10.24110   10.15310   10.06140
save(dat,group_list,file = 'step1-output.Rdata')
> save(dat,group_list,file = "step1-output.Rdata")  ##.RData以二进制的方式保存了会话中的变量值
> ?save
> ls()
 [1] "a"          "dat"        "f"          "gpl"        "group_list"
 [6] "gset"       "ids"        "pd"         "probe2gene" "x"
[11] "y"
> save("gpl","group_list","gset","ids","pd","probe2gene","a","x","y",file = "step1-all-test-files.Rdata")#保留所有新建的变量
然后在新Rstudio窗口中打开这个.Rdata文件,运行如下
> load("D:/RStudy/RScript/test_GSE42872_first try/step1-all-test-files.Rdata") ##load()读取.Rdata文件,绝对路径
Loading required package: Biobase
Loading required package: BiocGenerics
Loading required package: parallel

Attaching package: ‘BiocGenerics’

The following objects are masked from ‘package:parallel’:

    clusterApply, clusterApplyLB, clusterCall, clusterEvalQ,
    clusterExport, clusterMap, parApply, parCapply, parLapply,
    parLapplyLB, parRapply, parSapply, parSapplyLB

The following objects are masked from ‘package:stats’:

    IQR, mad, sd, var, xtabs

The following objects are masked from ‘package:base’:

    anyDuplicated, append, as.data.frame, basename, cbind, colnames,
    dirname, do.call, duplicated, eval, evalq, Filter, Find, get, grep,
    grepl, intersect, is.unsorted, lapply, Map, mapply, match, mget,
    order, paste, pmax, pmax.int, pmin, pmin.int, Position, rank,
    rbind, Reduce, rownames, sapply, setdiff, sort, table, tapply,
    union, unique, unsplit, which, which.max, which.min

Welcome to Bioconductor

    Vignettes contain introductory material; view with
    'browseVignettes()'. To cite Bioconductor, see
    'citation("Biobase")', and for packages 'citation("pkgname")'.

Loading required package: GEOquery
Setting options('download.file.method.GEOquery'='auto')
Setting options('GEOquery.inmemory.gpl'=FALSE)
> group_list
[1] "Control"     "Control"     "Control"     "Vemurafenib" "Vemurafenib"
[6] "Vemurafenib"
以上内容from https://github.com/jmzeng1314/GEO/blob/master/GSE42872_main/step1-download.R,在其基础上有自己的思考。
> gset$GSE42872_series_matrix.txt.gzExpressionSet (storageMode: lockedEnvironment)assayData: 33297 features, 6 samples element names: exprs protocolData: nonephenoData sampleNames: GSM1052615 GSM1052616 ... GSM1052620 (6 total) varLabels: title geo_accession ... cell type:ch1 (34 total) varMetadata: labelDescriptionfeatureData: noneexperimentData: use 'experimentData(object)' pubMedIds: 24469106 Annotation: GPL6244

 浙公网安备 33010602011771号