import os
import pandas as pd
import matplotlib.pyplot as plt
def test_run():
start_date='2017-01-01'
end_data='2017-12-15'
dates=pd.date_range(start_date, end_data)
# Create an empty data frame
df=pd.DataFrame(index=dates)
symbols=['SPY', 'AAPL', 'IBM', 'GOOG', 'GLD']
for symbol in symbols:
temp=getAdjCloseForSymbol(symbol)
df=df.join(temp, how='inner')
return df
def getAdjCloseForSymbol(symbol):
# Load csv file
temp=pd.read_csv("data/{0}.csv".format(symbol),
index_col="Date",
parse_dates=True,
usecols=['Date', 'Adj Close'],
na_values=['nan'])
# rename the column
temp=temp.rename(columns={'Adj Close': symbol})
return temp
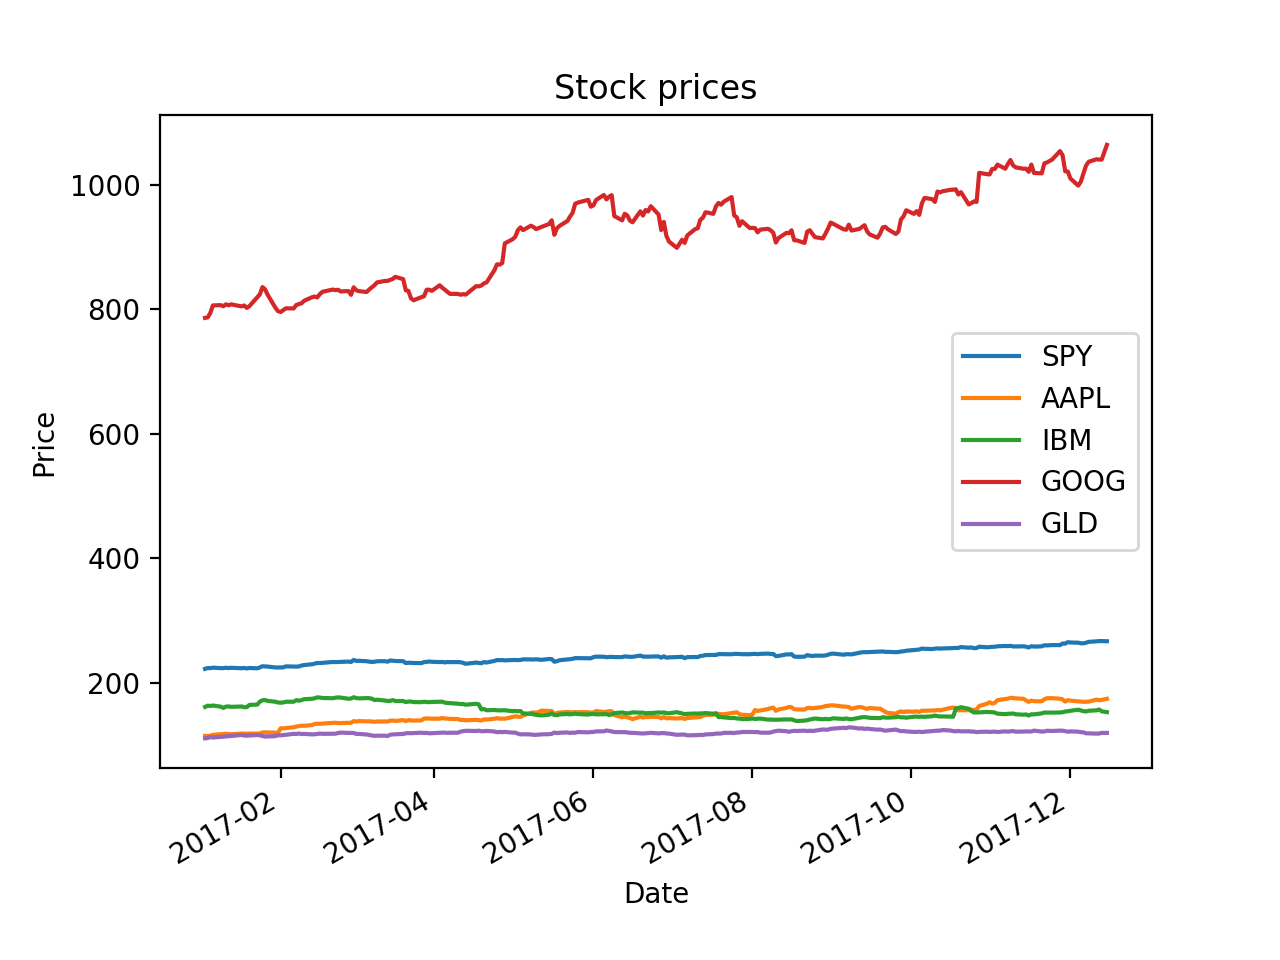
def plot_data(df, title="Stock prices"):
ax=df.plot(title=title, fontsize=10)
ax.set_xlabel("Date")
ax.set_ylabel("Price")
plt.show()
if __name__ == '__main__':
df=test_run()
# data=data.ix['2017-12-01':'2017-12-15', ['IBM', 'GOOG']]
plot_data(df)
"""
IBM GOOG
2017-12-01 154.759995 1010.169983
2017-12-04 156.460007 998.679993
2017-12-05 155.350006 1005.150024
2017-12-06 154.100006 1018.380005
2017-12-07 153.570007 1030.930054
2017-12-08 154.809998 1037.050049
2017-12-11 155.410004 1041.099976
2017-12-12 156.740005 1040.479980
2017-12-13 153.910004 1040.609985
2017-12-15 152.500000 1064.189941
"""

 浙公网安备 33010602011771号