Matplotlib 实例
Matplotlib Learning --- Examples
![]()
![]()
![]()
![]()
![]()
![]()
Real world examples
Load Necessary Libraries
In [3]:
import numpy as np
import pandas as pd
import matplotlib.pyplot as plt
Line graph
In [4]:
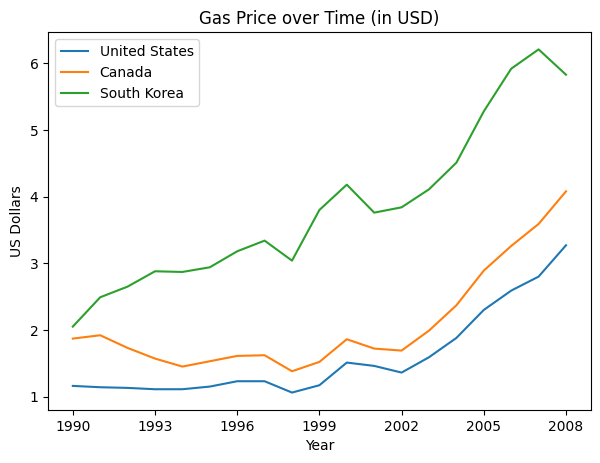
gas = pd.read_csv('gas_prices.csv')

plt.figure(figsize=(7,5),dpi=100)

plt.title('Gas Price over Time (in USD)')

plt.plot(gas.Year,gas.USA,label='United States')
plt.plot(gas.Year,gas.Canada,label='Canada')
plt.plot(gas["Year"],gas['South Korea'],label='South Korea')

plt.xticks(gas.Year[::3])

plt.xlabel('Year')
plt.ylabel('US Dollars')
plt.legend()

plt.show()
In [13]:
plt.figure(figsize=(7,5),dpi=100)

plt.title('Gas Price over Time (in USD)',fontdict={'fontweight':'bold','fontsize':22})

for country in gas:
    if country != 'Year':
        plt.plot(gas.Year,gas[country])

plt.xticks(gas.Year[::3].tolist()+[2011])

plt.xlabel('Year')
plt.ylabel('US Dollars')

plt.savefig('gas_price_figure',dpi=300)
plt.show()

Load Fifa Data
In [16]:
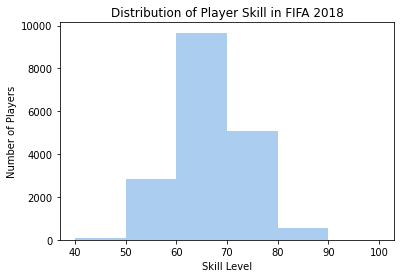
fifa = pd.read_csv('fifa_data.csv')
fifa.head()
Out[16]:
| Unnamed: 0 | ID | Name | Age | Photo | Nationality | Flag | Overall | Potential | Club | ... | Composure | Marking | StandingTackle | SlidingTackle | GKDiving | GKHandling | GKKicking | GKPositioning | GKReflexes | Release Clause | |
|---|---|---|---|---|---|---|---|---|---|---|---|---|---|---|---|---|---|---|---|---|---|
| 0 | 0 | 158023 | L. Messi | 31 | https://cdn.sofifa.org/players/4/19/158023.png | Argentina | https://cdn.sofifa.org/flags/52.png | 94 | 94 | FC Barcelona | ... | 96.0 | 33.0 | 28.0 | 26.0 | 6.0 | 11.0 | 15.0 | 14.0 | 8.0 | €226.5M |
| 1 | 1 | 20801 | Cristiano Ronaldo | 33 | https://cdn.sofifa.org/players/4/19/20801.png | Portugal | https://cdn.sofifa.org/flags/38.png | 94 | 94 | Juventus | ... | 95.0 | 28.0 | 31.0 | 23.0 | 7.0 | 11.0 | 15.0 | 14.0 | 11.0 | €127.1M |
| 2 | 2 | 190871 | Neymar Jr | 26 | https://cdn.sofifa.org/players/4/19/190871.png | Brazil | https://cdn.sofifa.org/flags/54.png | 92 | 93 | Paris Saint-Germain | ... | 94.0 | 27.0 | 24.0 | 33.0 | 9.0 | 9.0 | 15.0 | 15.0 | 11.0 | €228.1M |
| 3 | 3 | 193080 | De Gea | 27 | https://cdn.sofifa.org/players/4/19/193080.png | Spain | https://cdn.sofifa.org/flags/45.png | 91 | 93 | Manchester United | ... | 68.0 | 15.0 | 21.0 | 13.0 | 90.0 | 85.0 | 87.0 | 88.0 | 94.0 | €138.6M |
| 4 | 4 | 192985 | K. De Bruyne | 27 | https://cdn.sofifa.org/players/4/19/192985.png | Belgium | https://cdn.sofifa.org/flags/7.png | 91 | 92 | Manchester City | ... | 88.0 | 68.0 | 58.0 | 51.0 | 15.0 | 13.0 | 5.0 | 10.0 | 13.0 | €196.4M |
5 rows × 89 columns
Histogram
In [31]:
bins = [i*10 for i in range(4,11)]

plt.hist(fifa.Overall,bins,color = '#abcdef')

plt.xticks(bins)

plt.ylabel('Number of Players')
plt.xlabel('Skill Level')
plt.title('Distribution of Player Skill in FIFA 2018')
plt.show()
Pie chart
In [56]:
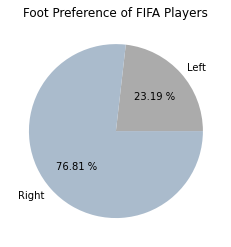
left = fifa.loc[fifa['Preferred Foot']=='Left'].count()[0]
right = fifa.loc[fifa['Preferred Foot']=='Right'].count()[0]

labels = ['Left','Right']
colors = ['#ababab','#aabbcc']
plt.pie([left,right],labels = labels,colors = colors,autopct='%.2f%%')
plt.title('Foot Preference of FIFA Players')

plt.show()
In [90]:
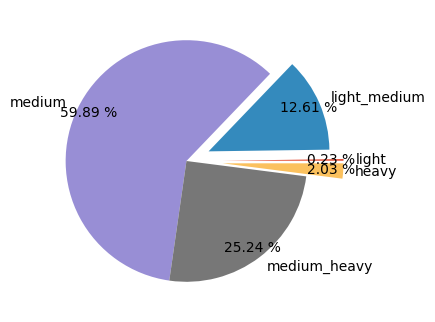
fifa.Weight = [int(x.strip('lbs')) if type(x)==str else x for x in fifa.Weight]

plt.figure(dpi=100)
plt.style.use('ggplot')

light = fifa.loc[fifa.Weight<125].count()[0]
light_medium = fifa.loc[(fifa.Weight>=125) & (fifa.Weight<150)].count()[0]
medium = fifa.loc[(fifa.Weight>=150) & (fifa.Weight<175)].count()[0]
medium_heavy = fifa.loc[(fifa.Weight>=175) & (fifa.Weight<200)].count()[0]
heavy = fifa.loc[fifa.Weight>=200].count()[0]
explode = [0.3,0.2,0,0,0.3]

labels = ['light','light_medium','medium','medium_heavy','heavy']
plt.pie([light,light_medium,medium,medium_heavy,heavy],labels=labels,autopct='%.2f%%',pctdistance=0.9,explode=explode)
plt.show()
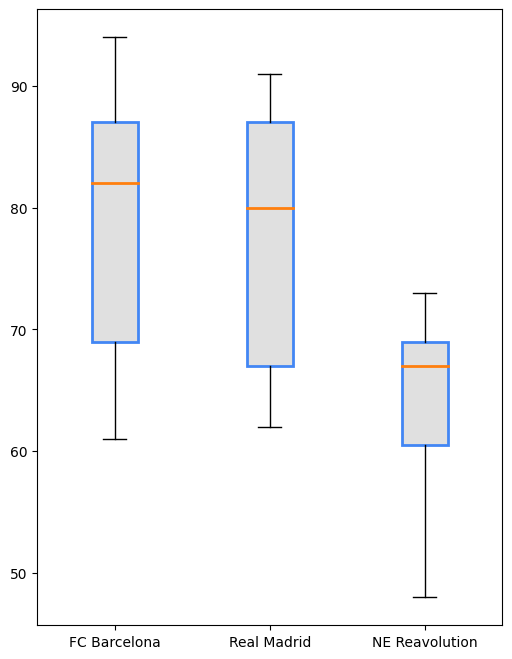
In [119]:
plt.style.use('default')

plt.figure(figsize=(6,8),dpi=100)

barcelona = fifa.loc[fifa.Club == 'FC Barcelona']['Overall']
madrid = fifa.loc[fifa.Club == 'Real Madrid']['Overall']
revs = fifa.loc[fifa.Club == 'New England Revolution']['Overall']

labels = ['FC Barcelona','Real Madrid','NE Reavolution']

boxes = plt.boxplot([barcelona,madrid,revs],labels = labels,patch_artist=True,medianprops={'linewidth':2})
for box in boxes['boxes']:
    box.set(color='#4286f4',linewidth=2)
    box.set(facecolor = "#e0e0e0")

plt.show()

 浙公网安备 33010602011771号