Matplotlib 基础应用
Matplotlib Learning --- Basics
![]()
![]()
Load Necessary Libraries
In [4]:
import matplotlib.pyplot as plt
import numpy as np
import pandas as pd
Basic Graph
In [84]:
x = [0,1,2,3,4]
y = [0,2,4,6,8]

# Resize your Graph
plt.figure(figsize=(6,4),dpi=100)

#plt.plot(x,y,label='y=2x',color='red',linewidth=2,marker='o',markersize=10,markeredgecolor='blue',linestyle='--')
#use shorthand notation:fmt ='[color][marker][line]'
plt.plot(x,y,'r*--',label='2x')

## Line 2

# Select the interval we want to plot points at
x2 = np.arange(0,4.5,0.5)
# Plot part of the graph
plt.plot(x2[:5],x2[:5]**2,'b.-',label='x^2')

# Plot the remaining part
plt.plot(x2[4:],x2[4:]**2,'bv-')

# Add a title(specify fontparameters with fontdict)
plt.title('Our First Graph',fontdict={'fontsize':20})

# x & y labels
plt.xlabel('X Axis',fontdict={'fontname':'Comic Sans MS'})
plt.ylabel('Y Axis')
plt.xticks([1,2,3,4])
plt.yticks([0,2,4,8,16])

# Save and show
plt.legend()
plt.savefig('mygragh.png',dpi=100)
plt.show()

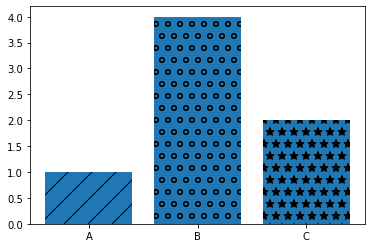
Bar chart
In [96]:
labels = ['A','B','C']
values = [1,4,2]

bars = plt.bar(labels,values)
patterns = ['/','o','*']
for bar in bars:
    bar.set_hatch(patterns.pop(0))
#bars[0].set_hatch('/')

plt.figure(figsize=(6,4))
plt.show()
<Figure size 432x288 with 0 Axes>

 浙公网安备 33010602011771号