Zabbix + Grafana 可视化
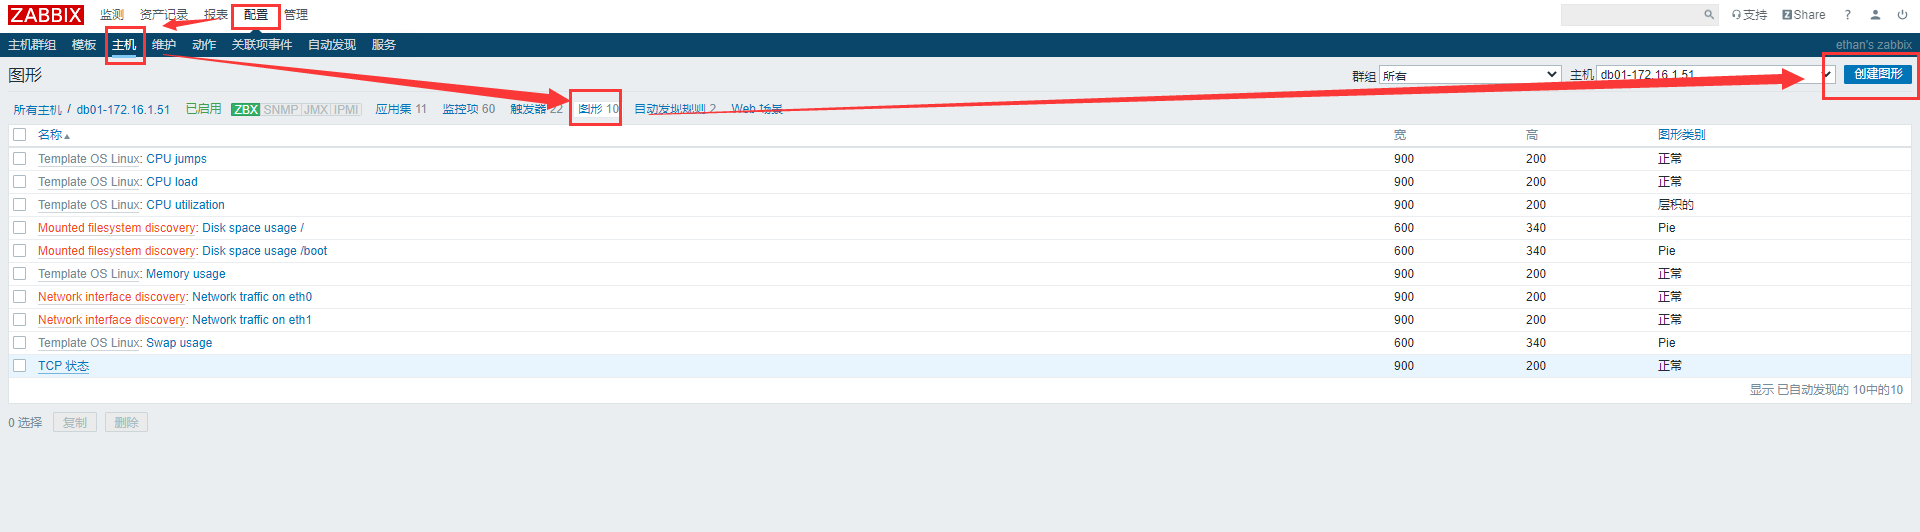
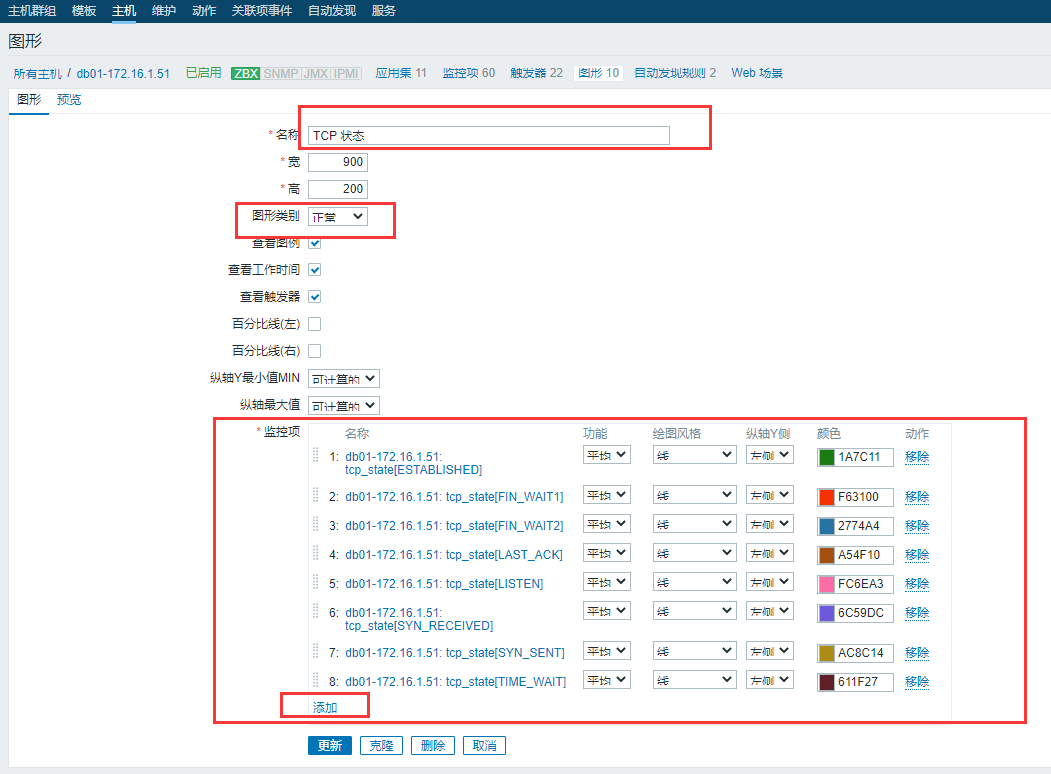
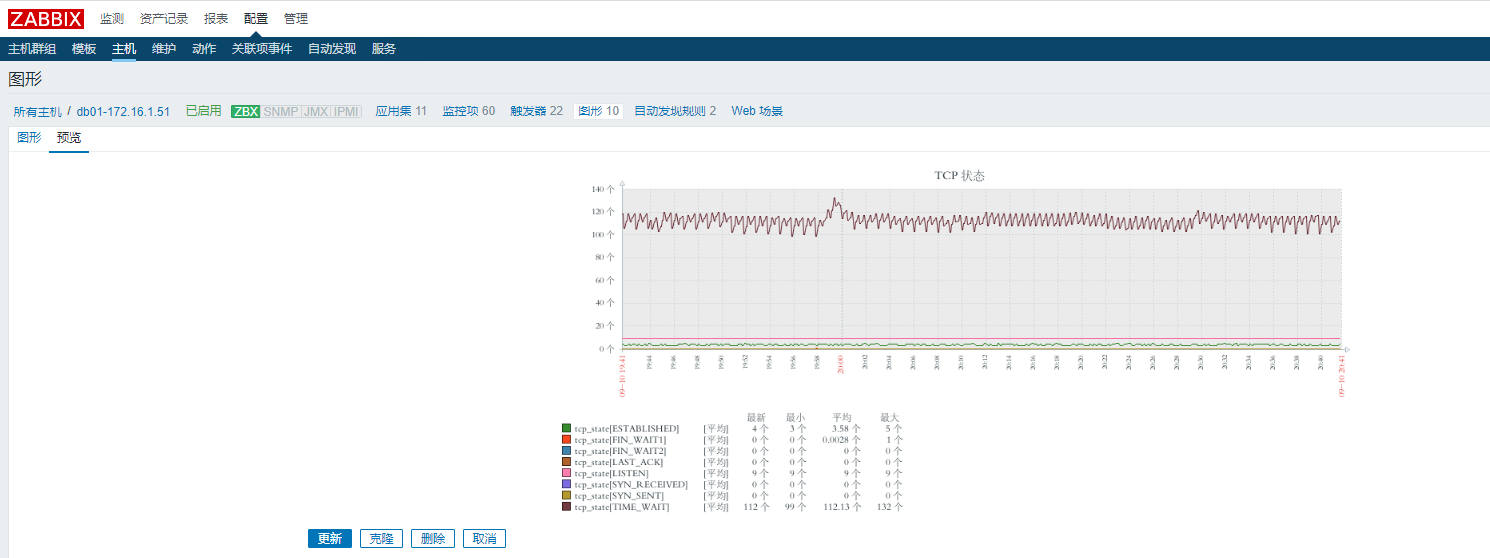
Zabbix 自定义图形
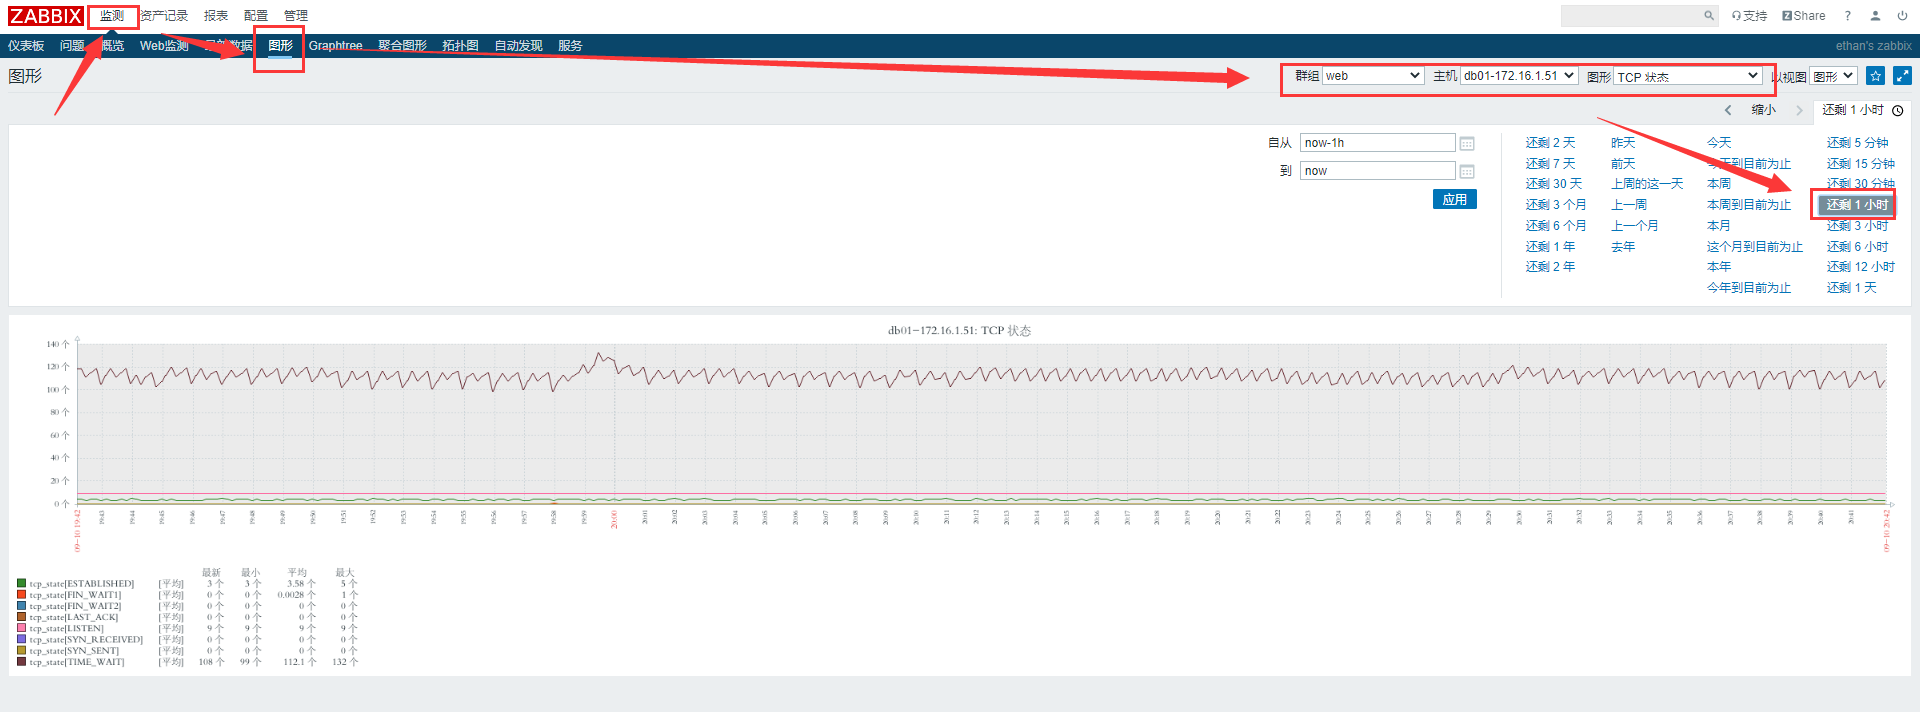
Zabbix 自带图形
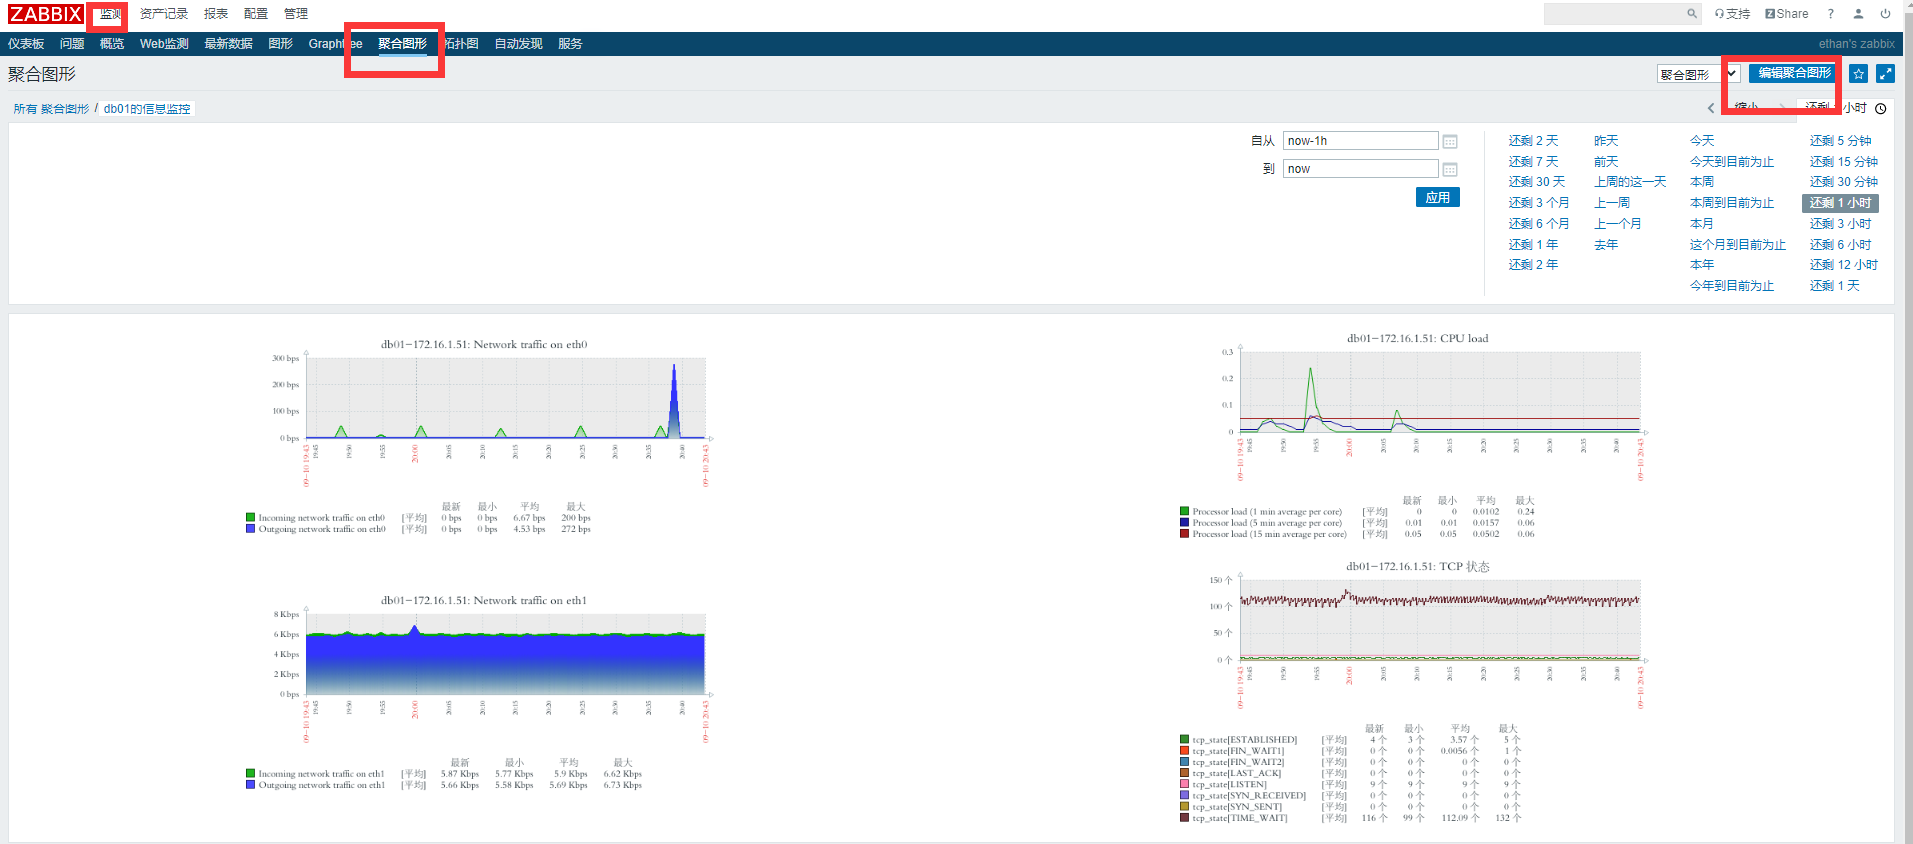
Zabbix 图形树安装
# 1.上传
[root@zabbix ~]# cd /usr/share/zabbix
[root@zabbix zabbix]# wget https://www.itsky.tech/download/zabbix/graphtree3.0.4.patch

# 2.导入,要进入目录运行 patch 命令
[root@zabbix zabbix]# yum install -y patch
[root@zabbix zabbix]# patch -Np0 < graphtree3.0.4.patch

# 3.移动并授权
[root@zabbix zabbix]# mv oneoaas /usr/share/zabbix/
[root@zabbix zabbix]# chown -R apache.apache /usr/share/zabbix/oneoaas

# 4.修改 Apache 配置⽂文件
[root@zabbix zabbix]# vim /etc/httpd/conf.d/zabbix.conf
[root@zabbix zabbix]# Alias /oneoaas /usr/share/zabbix/oneoaas

# 5.重启 httpd 服务
[root@zabbix zabbix]# systemctl restart httpd
Grafana 可视化工具
下载 Grafana
# 下载地址:https://mirrors.tuna.tsinghua.edu.cn/
[root@zabbix ~]# wget https://mirrors.tuna.tsinghua.edu.cn/grafana/yum/rpm/grafana-6.6.1-1.x86_64.rpm
安装 Grafana
[root@zabbix ~]# yum localinstall -y grafana-6.6.2-1.x86_64.rpm
启动 Grafana
[root@zabbix ~]# systemctl start grafana-server.service

# 验证
[root@zabbix ~]# netstat -lntp | grep 3000
tcp6       0      0 :::3000         :::*          LISTEN      46915/grafana-server
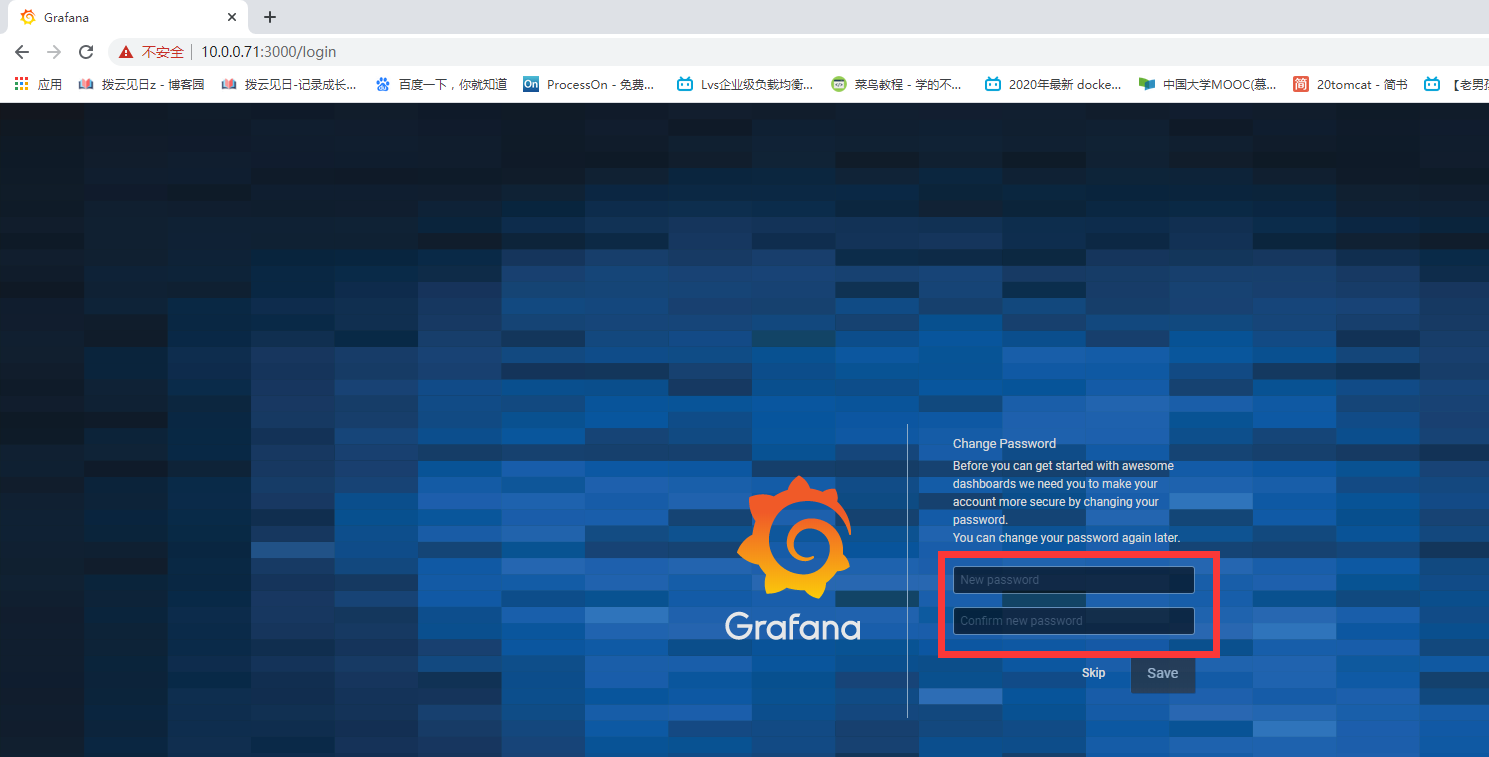
访问 Grafana Web
# 访问
http://10.0.0.71:3000/login

# 登录
用户:admin
密码:admin

# 登录后让你重新配置新的密码
123456
123456

安装 Grafana-zabbix 插件
# 查看插件列表
[root@zabbix ~]# grafana-cli plugins list-remote

# 找到 zabbix 插件
[root@zabbix ~]# grafana-cli plugins list-remote | grep zabbix
id: alexanderzobnin-zabbix-app version: 4.0.1
[root@zabbix ~]# grafana-cli plugins install alexanderzobnin-zabbix-app

# 安装插件失败,因为源在国外,可以使用以下方式
[root@zabbix ~]# cd /var/lib/grafana/plugins/
[root@zabbix plugins]# wget https://www.itsky.tech/download/zabbix/alexanderzobnin-zabbix-app.tar.gz
[root@zabbix plugins]# tar xf alexanderzobnin-zabbix-app.tar.gz
[root@zabbix plugins]# ll
total 9320
drwxr-xr-x 8 root root    4096 May 20 10:57 alexanderzobnin-zabbix-app
-rw-r--r-- 1 root root 9537875 Sep 10 17:26 alexanderzobnin-zabbix-app.tar.gz

# 重启
[root@zabbix plugins]# systemctl restart grafana-server.service
使用 Grafana
1.登录页面 --- 设置 --- plugins
2.点击 zabbix 插件 --- enable
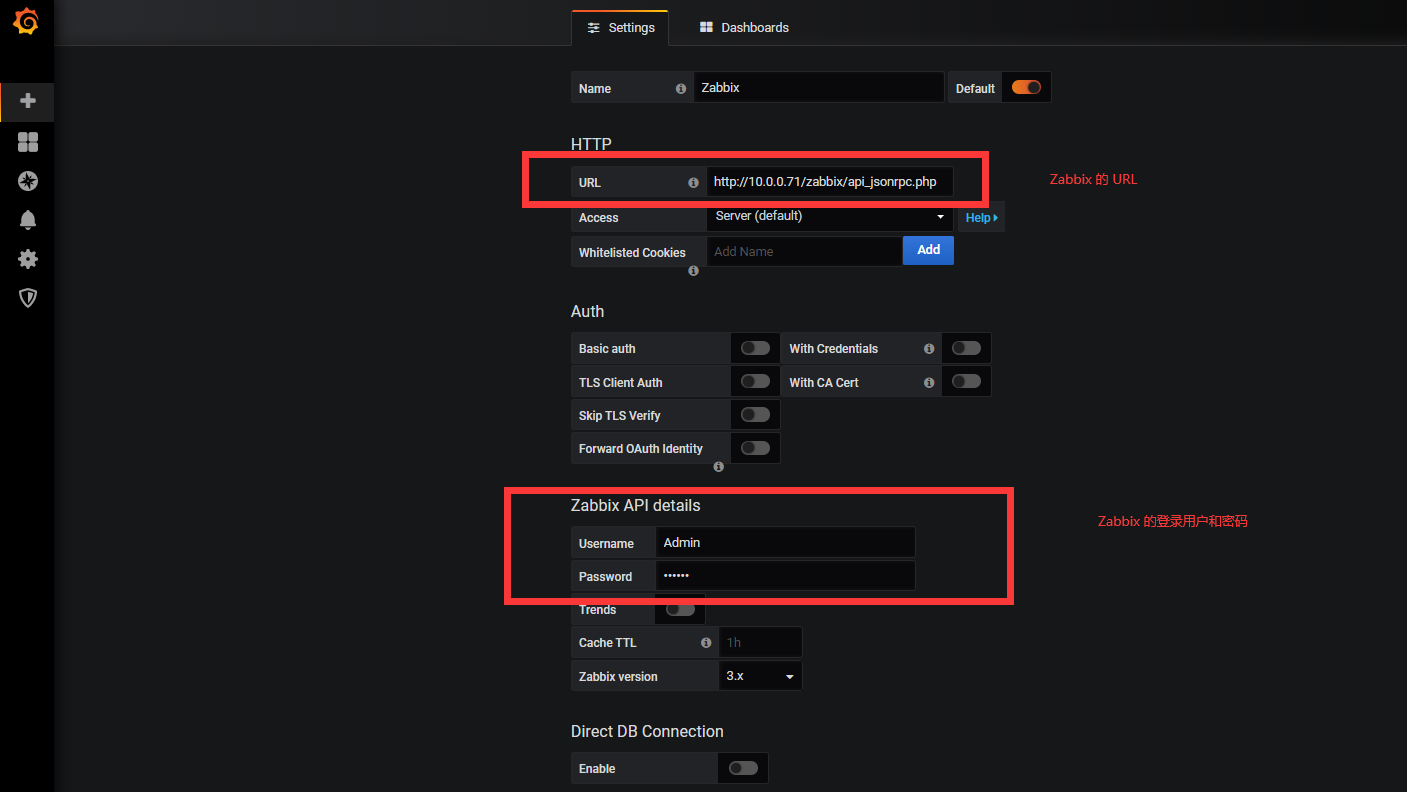
3.设置 --- add data source --- 选择 zabbix
4.配置 zabbix 信息
http://10.0.0.71/zabbix/api_jsonrpc.php

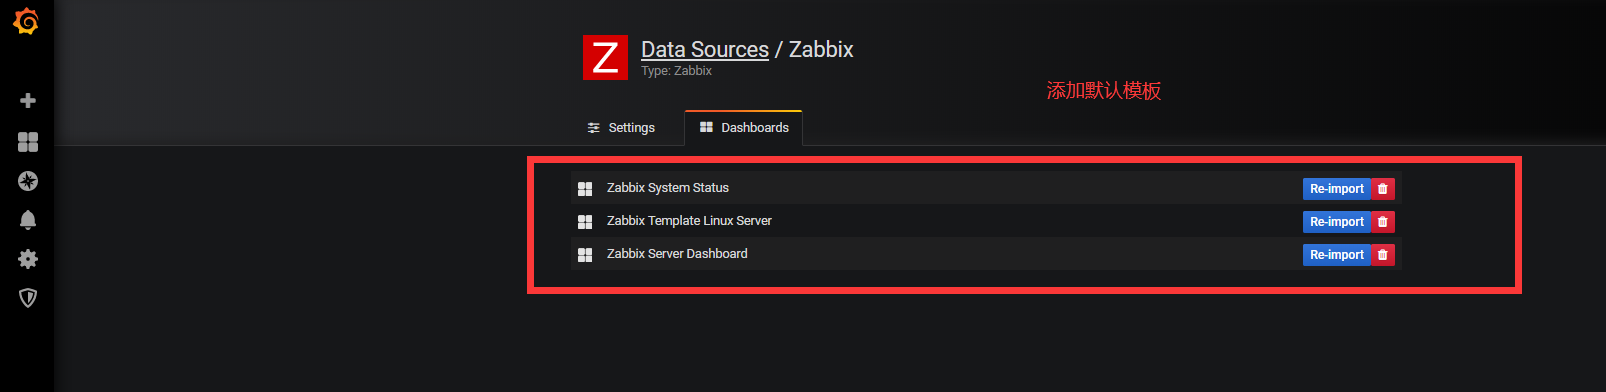
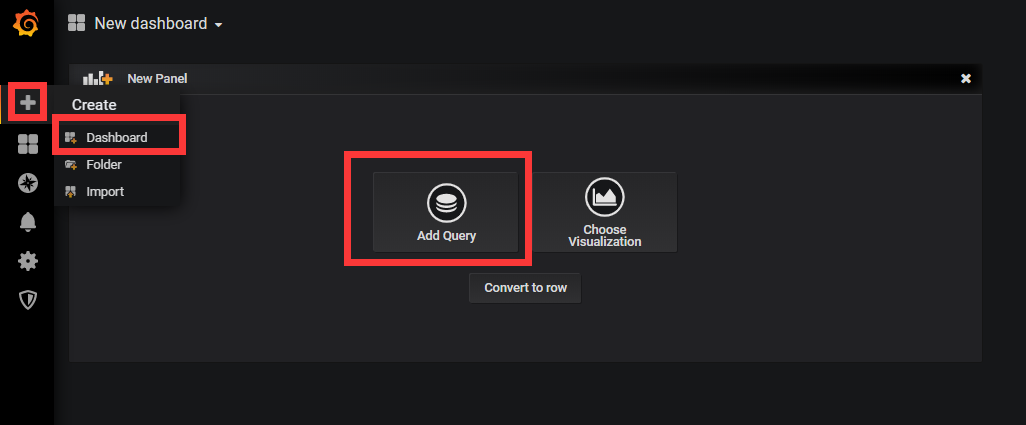
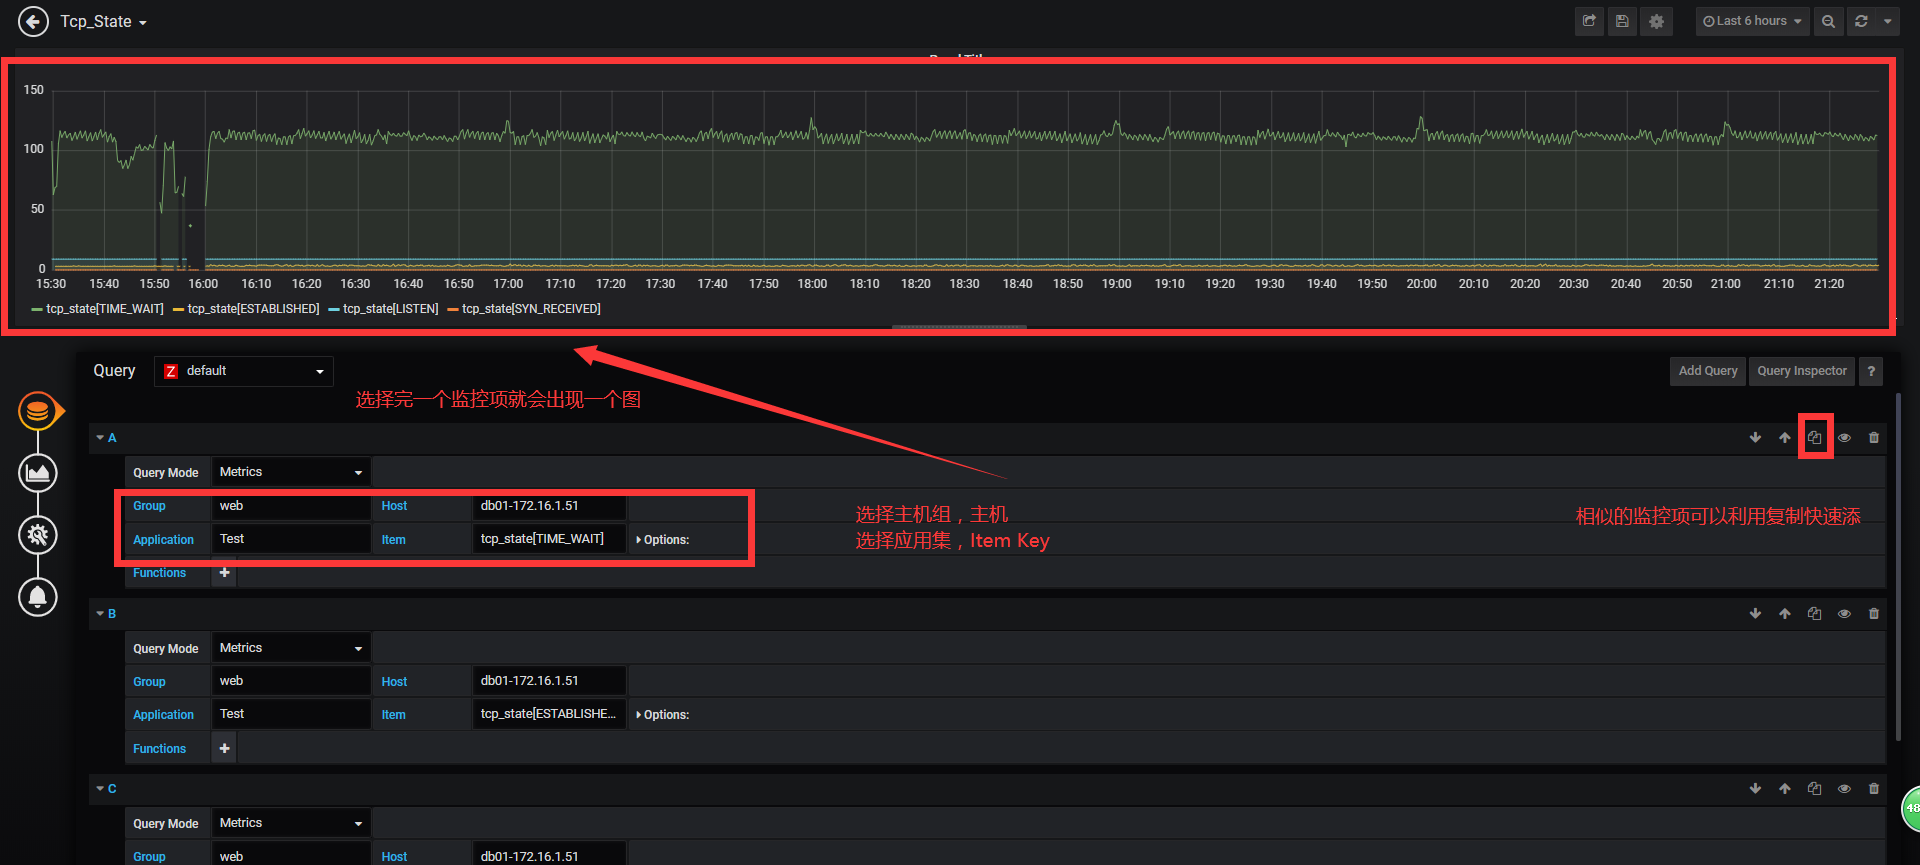
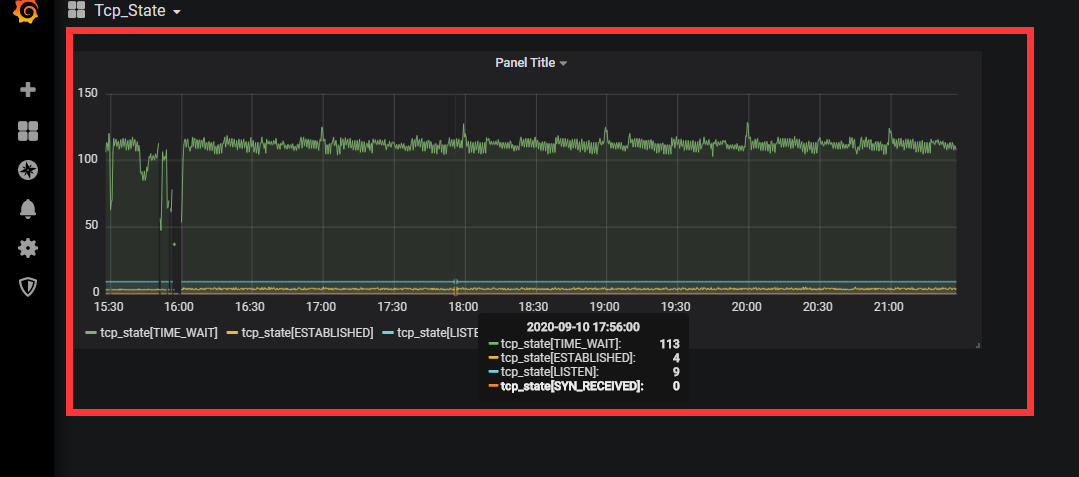
配置 Grafana Dashboard
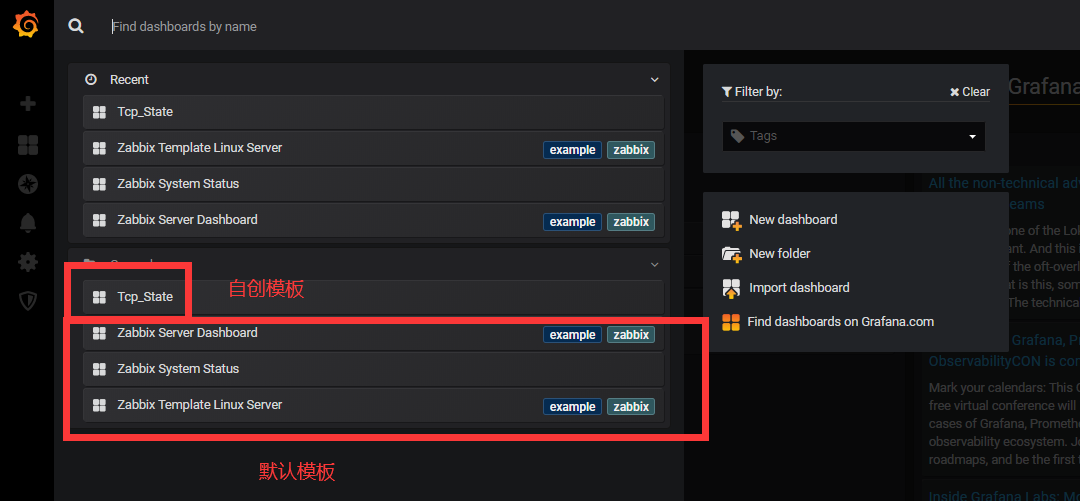
创建模板:
查看默认模板:
记录成长过程

 浙公网安备 33010602011771号