
横截面数据分类——基于R
参考资料:
《复杂数据统计方法》&网络&帮助文件
适用情况:在因变量为分类变量而自变量含有多个分类变量或分类变量水平较多的情况。
一.
(一)概论和例子
数据来源:http://archive.ics.uci.edu/ml/datasets/Cardiotocography
自变量:LB - FHR baseline (beats per minute)
AC - # of accelerations per second
FM - # of fetal movements per second
UC - # of uterine contractions per second
DL - # of light decelerations per second
DS - # of severe decelerations per second
DP - # of prolongued decelerations per second
ASTV - percentage of time with abnormal short term variability
MSTV - mean value of short term variability
ALTV - percentage of time with abnormal long term variability
MLTV - mean value of long term variability
Width - width of FHR histogram
Min - minimum of FHR histogram
Max - Maximum of FHR histogram
Nmax - # of histogram peaks
Nzeros - # of histogram zeros
Mode - histogram mode
Mean - histogram mean
Median - histogram median
Variance - histogram variance
Tendency - histogram tendency
CLASS - FHR pattern class code (1 to 10)
因变量:
NSP - fetal state class code (N=normal; S=suspect; P=pathologic)
(二)产生交叉验证数据集
1.十折交叉验证 概念(百度百科)
英文名叫做10-fold cross-validation,用来测试算法准确性。是常用的测试方法。将数据集分成十分,轮流将其中9份作为训练数据,1份作为测试数据,进行试验。每次试验都会得出相应的正确率(或差错率)。10次的结果的正确率(或差错率)的平均值作为对算法精度的估计,一般还需要进行多次10折交叉验证(例如10次10折交叉验证),再求其均值,作为对算法准确性的估计。
之所以选择将数据集分为10份,是因为通过利用大量数据集、使用不同学习技术进行的大量试验,表明10折是获得最好误差估计的恰当选择,而且也有一些理论根据可以证明这一点。但这并非最终诊断,争议仍然存在。而且似乎5折或者20折与10折所得出的结果也相差无几。
Fold=function(Z=10,w,D,seed=7777){
n=nrow(w)
d=1:n
dd=list()
e=levels(w[,D])
T=length(e)
set.seed(seed)
for(i in 1:T){
d0=d[w[,D]==e[i]]
j=length(d0)
ZT=rep(1:Z,ceiling(j/Z))[1:j]
id=cbind(sample(ZT,length(ZT)),d0)
dd[[i]]=id}
mm=list()
for(i in 1:Z){u=NULL;
for(j in 1:T)u=c(u,dd[[j]][dd[[j]][,1]==i,2])
mm[[i]]=u}
return(mm)}
#读入数据
w=read.csv("CTG.NAOMIT.csv")
#因子化最后三个哑元变量
F=21:23 #三个分类变量的列数
for(i in F)
w[,i]=factor(w[,i])
D=23 #因变量的位置
Z=10 #折数
n=nrow(w)#行数
mm=Fold(Z,w,D,8888)
二.决策树分类(分类树)
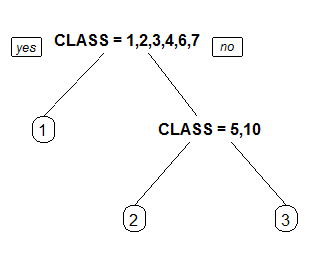
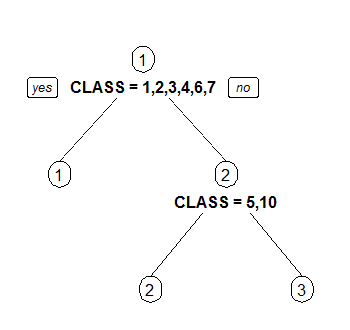
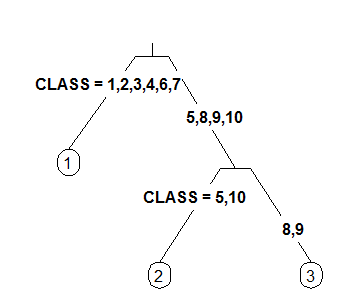
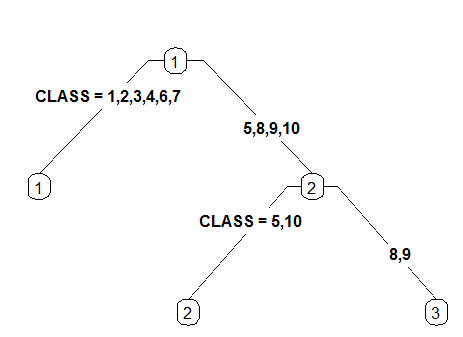
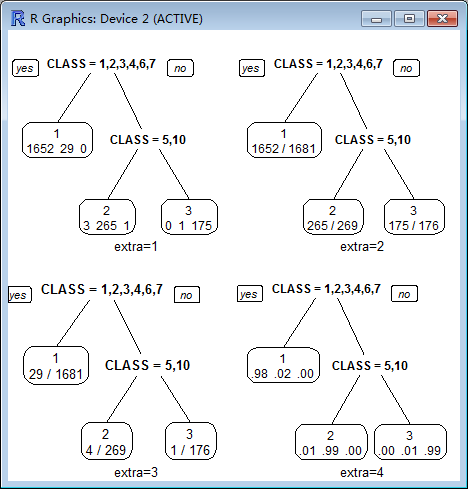
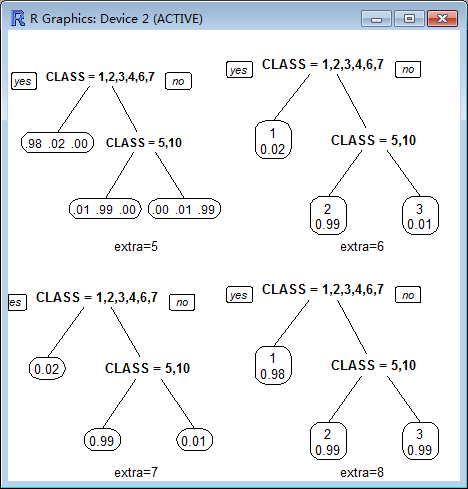
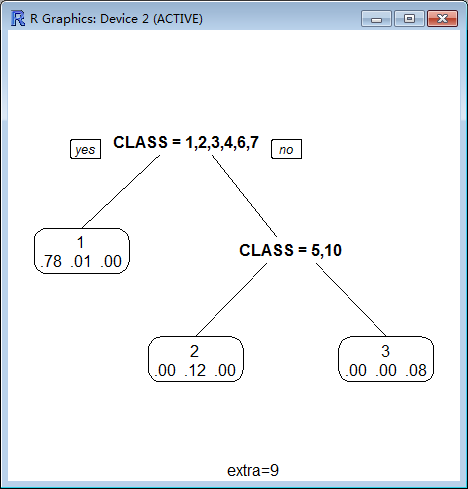
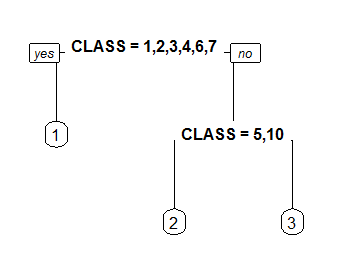
library(rpart.plot)
(a=rpart(NSP~.,w))#用决策树你和全部数据并打印输出
rpart.plot(a,type=2,extra=4)
rpart.plot参数解释:
x :
An rpart object. The only required argument.
type:
Type of plot. Five possibilities:
0 The default. Draw a split label at each split and a node label at each leaf.
1 Label all nodes, not just leaves. Similar to text.rpart's all=TRUE.

2 Like 1 but draw the split labels below the node labels. Similar to the plots in the CART book.
3 Draw separate split labels for the left and right directions.
4 Like 3 but label all nodes, not just leaves. Similar to text.rpart's fancy=TRUE. See also clip.right.labs.
extra :
Display extra information at the nodes. Possible values:
0 No extra information (the default).
1 Display the number of observations that fall in the node (per class for class objects; prefixed by the number of events for poisson and exp models). Similar to text.rpart's use.n=TRUE.
2 Class models: display the classification rate at the node, expressed as the number of correct classifications and the number of observations in the node. Poisson and exp models: display the number of events.
3 Class models: misclassification rate at the node, expressed as the number of incorrect classifications and the number of observations in the node.
4 Class models: probability per class of observations in the node (conditioned on the node, sum across a node is 1).
5 Class models: like 4 but do not display the fitted class.
6 Class models: the probability of the second class only. Useful for binary responses.
7 Class models: like 6 but do not display the fitted class.
8 Class models: the probability of the fitted class.
9 Class models: the probabilities times the fraction of observations in the node (the probability relative to all observations, sum across all leaves is 1).
branch:
Controls the shape of the branch lines. Specify a value between 0 (V shaped branches) and 1 (square shouldered branches). Default is if(fallen.leaves) 1 else .2.

branch=0
branch=1
digits :
The number of significant digits in displayed numbers. Default 2.
rpart.plot(a,extra=4,digits=4)


 浙公网安备 33010602011771号