


记录一下自定义 Echarts 中的一些问题

先上最终效果图;
我们的需求是,输入车牌和日期后,展示出该车辆在不通时间下的停车记录。
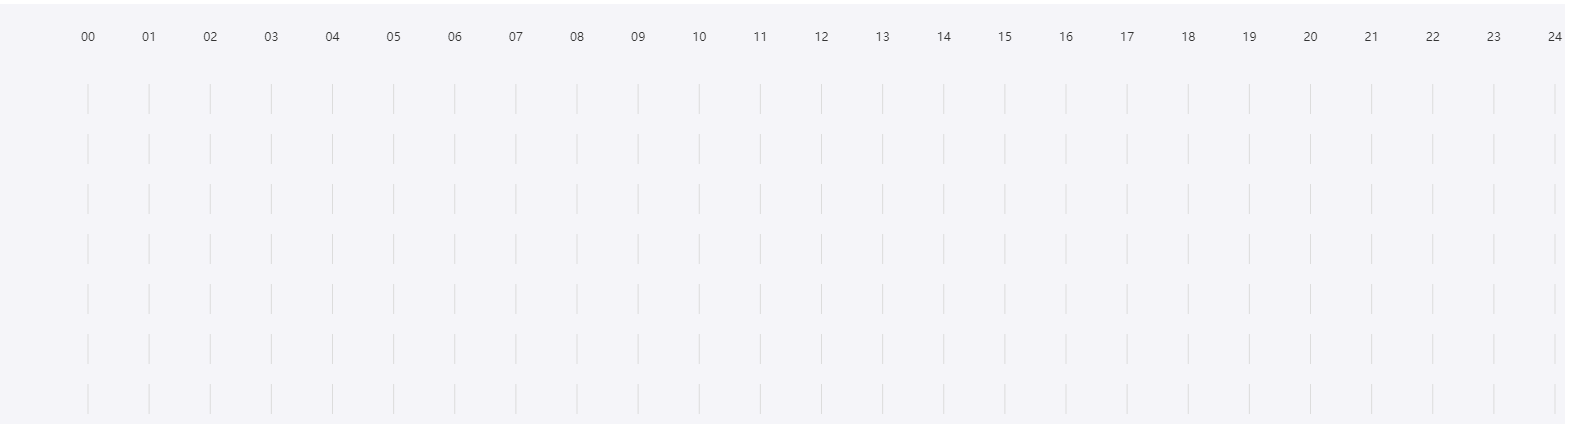
首先拿到原型和效果图先要画出上面的时间:
{
          type: 'custom',
          renderItem: function(params, api){
            console.log()
            let x = ( ((that.chartW - 100) / 48) * (api.value(0) -  1)) + 45;  // 绘制时间的位置
            let children = [
              {
                type: 'text',
                style: {
                    x: x,
                    y: 30,
                    text: api.value(1) < 10 ? '0' + api.value(1) : api.value(1),
                    textVerticalAlign: 'bottom',
                    textAlign: 'center',
                    textFill: '#333'
                }
              }
            ]
            // 到时候要换成数据的length;   绘制每个时间下面的竖着的虚线
            for(let i=0;i< 7; i++){
              let obj = {
                type: 'polyline',
                z2: 10,
                x: 52,
                y: 50,
                style: {
                    fill: '#DCDCDC',
                    stroke: '#DCDCDC',
                    lineWidth: 1
                },
                shape: {
                  points: [[x-52, 20 + (50 * i)], [x-52, 50 + (50 * i)]]
                }
              }
              children.push(obj)
            }

            return {
              type: 'group',
              position: [
                x,
                10
              ],
              children: children
            }
          },
          encode: {
              x: -20,
              y: 0
          },
          data: [
            [1, '00'],
            [2, '01'],
            [3, '02'],
            [4, '03'],
            [5, '04'],
            [6, '05'],
            [7, '06'],
            [8, '07'],
            [9, '08'],
            [10, '09'],
            [11, '10'],
            [12, '11'],
            [13, '12'],
            [14, '13'],
            [15, '14'],
            [16, '15'],
            [17, '16'],
            [18, '17'],
            [19, '18'],
            [20, '19'],
            [21, '20'],
            [22, '21'],
            [23, '22'],
            [24, '23'],
            [25, '24'],
          ]
 }
这样先把上面的时间画出来了
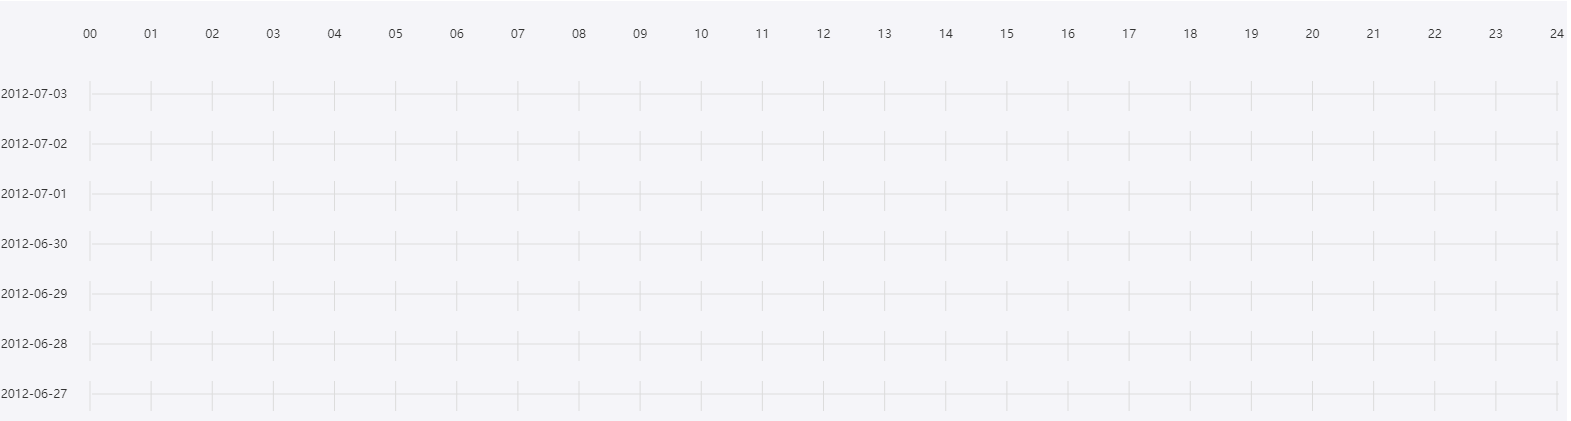
然后画左边Y轴的时间,和横着的线
{
          type: 'custom',
          renderItem: function(params, api){
            let y =(that.dataLenght.length - api.value(0)) * 50 + 50;
            let x = ( ((that.chartW - 100) / 48) * (api.value(0) -  1)) + 45   // 根据数据条数判断Echart容器的高度,然后判断每个条目的位置
            return {
              type: 'group',
              position: [
                10,
                y
              ],
              children: [
                {
                  type: 'text',
                  style: {
                      x: 24,
                      y: 50,
                      text: api.value(1),
                      textVerticalAlign: 'bottom',
                      textAlign: 'center',
                      textFill: '#333'
                  }
                },
                {
                  type: 'line',
                  z2: 10,
                  x: 52,
                  y: 50,
                  style: {
                      fill: '#DCDCDC',
                      stroke: '#DCDCDC',
                      // fill: 'red',
                      // stroke: 'red',
                      lineWidth: 1
                  },
                  shape: {
                    x1: 30,
                    y1: -7,
                    x2: that.chartW - 70,
                    y2: -7
                  }
                }
              ]
            }
          },
          // dimensions: _rawData.parkingApron.dimensions,
          encode: {
              x: -20, // Then this series will not controlled by x.
              y: 0
          },
          data: [
            [7, '2012-07-03'],
            [6, '2012-07-02'],
            [5, '2012-07-01'],
            [4, '2012-06-30'],
            [3, '2012-06-29'],
            [2, '2012-06-28'],
            [1, '2012-06-27']
          ]
}
这样Y轴时间和横线就出来了
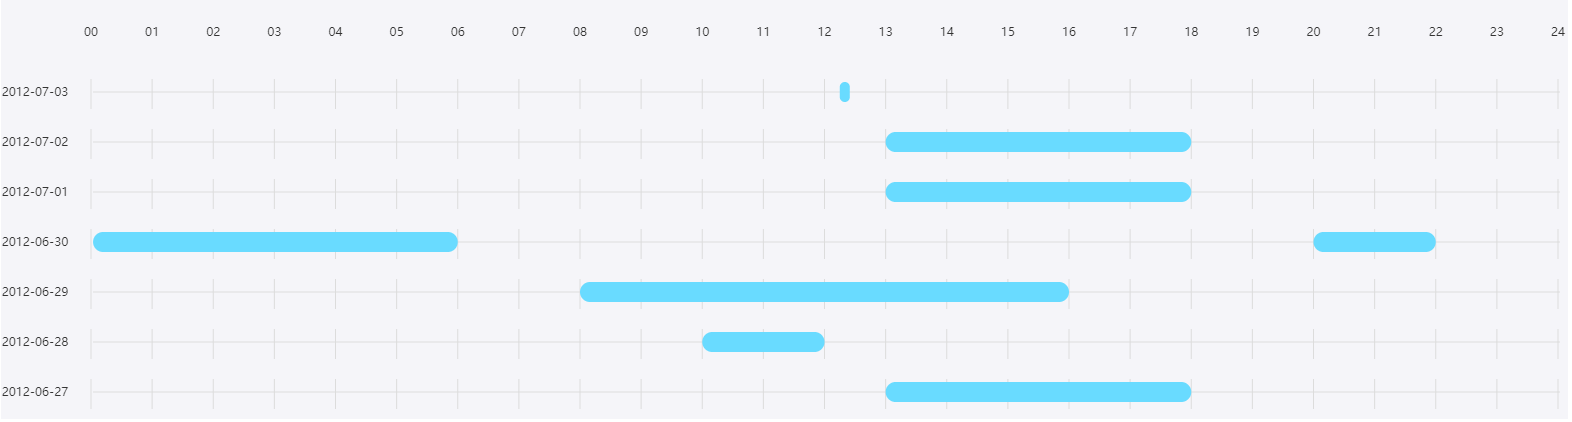
接下来就是根据时间画停车记录了
{
          type: 'custom',
          renderItem: function(params, api){
            function clipRectByRect(params, rect, customParams) {
              return {...that.$echarts.graphic.clipRectByRect(rect, {
                  x: params.coordSys.x,
                  y: params.coordSys.y,
                  width: params.coordSys.width,
                  height: params.coordSys.height
              }), ...customParams};  // 传入自定义参数后面鼠标移入提示用
            }

            const categoryIndex = api.value(0);

            let parkLen = that.dataLenght[categoryIndex - 1];

            let children = [];
            let x = '';
            let barLength = '';

            let totalTime = 86400000;           // 一天从0点-24点的毫秒数
            let startTimeStr = 1340985600000;   // 2012.6.30  00:00:00

            for(let i = 0; i < parkLen; i++){
              let startParkTime = api.value(1 + (i * 2));  // 停车记录开始时间
              let endParkTime = api.value(2 + (i * 2));    // 停车记录结束时间
              let plusVal = endParkTime - startParkTime;
              barLength = (plusVal / totalTime) * (that.chartW - 100);  // 柱状图长度
              if (barLength && barLength < 10) {    // 测试停车时长只有1分钟就出场了,时间太短,柱状图太小,看不见而且无法点击问题,增加最小长度
                barLength = 10
              }
              let plusStartTime = startParkTime - startTimeStr;

              x = 90 + ( plusStartTime / totalTime) * (that.chartW - 100) ;  // 柱状图起始位置
              let rectNormal = clipRectByRect(params, {
                x: x, y: (that.dataLenght.length - api.value(0)) * 50 + 83 , width: barLength, height: 20
              }, {startParkTime: startParkTime, endParkTime: endParkTime, categoryIndex: categoryIndex});
              if (rectNormal) {
                rectNormal.r = [10] // 设置圆角
              }
              let parkObj = {
                type: 'rect',
                z2: 20,
                shape: rectNormal,
                style: api.style({fill: '#69DBFF', borderRadius: 10})
              };

              children.push(parkObj)
              that.catchChildren.push(rectNormal)
            }


            return {
              type: 'group',
              children: children
            };

          },
          encode: {
              x: [1, 2],
              y: 0,
              tooltip: [0, 1, 2]
          },
          data: [
            [7, 1341029700000, 1341029900000, 'null', 'null'],   // 12:15 - 14:48
            [6, 1341032400000, 1341050400000, 'null', 'null'],   // 2012年6月30日 13 - 18
            [5, 1341032400000, 1341050400000, 'null', 'null'],   // 13 - 18
            [4, 1340985600000, 1341007200000, 1341057600000, 1341064800000], // 0 - 6, 20 - 22   new Date('2012-06-30 00:00:00').getTime()
            [3, 1341014400000, 1341043200000, 'null', 'null'],  // 8 -16
            [2, 1341021600000, 1341028800000, 'none', 'null'],  // 10点 - 12点
            [1, 1341032400000, 1341050400000, 'null', 'null']   // 13 - 18
          ]
}
绘制停车记录有几个坑:1是数据必须长度需要和停车记录最多的数据是一样的(否则如果第一个记录有1条停车记录,后面有多条停车记录的也只能绘制出一个)。2、是圆角要设置 ‘r’ 属性才能显示(文档里没有)
这样停车记录就出来了
剩下就是鼠标移入显示对应数据,和显示提示框的位置
// 鼠标移入显示toolTip
    this.myChart.on('mousemove', function (event) {

      if (that.catchMoveItem && that.catchMoveItem.categoryIndex && that.catchMoveItem.categoryIndex == event.event.target.shape.categoryIndex && that.catchMoveItem.startParkTime == event.event.target.shape.startParkTime) {
        that.moveToolTipFn(event)
        return
      }

      let targetDom = event.event.target.shape;
      // 鼠标移动到自定义X,Y轴不显示提示
      if (!targetDom || targetDom.points) {
        return
      }

      let ev = event.event;
      console.log('11111', event)
      that.myChart.dispatchAction({
        type: 'highlight',
        seriesIndex: event.seriesIndex
      })
      that.catchMoveItem = targetDom;  // 换存当前移动的对象
      that.showToolTipFn(ev.offsetX, ev.offsetY, targetDom)
 })
显示toolTip位置
showToolTipFn(x, y, obj) {
      let customOffsetX = 10;
      let customOffsetY = 20;

      // 右边界
      if (this.chartW - x < 250) {
        customOffsetX = -200
      }

      // 下边界  // 可以优化获取tip宽高
      if (400 - y < 100) {
        customOffsetY = -80
      }

      this.toolTipDom.style.left = x + customOffsetX + 'px';
      this.toolTipDom.style.top = y + customOffsetY + 'px';
      this.toolTipObj = Object.assign({}, obj)
      this.showToolTip = true;
 }
总结:通过这次自定义Echarts开发,后面发现数据可以通过{name:'', value: []}这种方式传递,后面可以进行优化。
