
Prometheus+Grafana+Altermanager企业微信告警
Prometheus概述
Prometheus(普罗米修斯)是一套开源的监控&报警&时间序列数据库的组合,起始是由SoundCloud公司开发的。随着发展,越来越多公司和组织接受采用Prometheus,社会也十分活跃,他们便将它独立成开源项目,并且有公司来运作。Google SRE的书内也曾提到跟他们BorgMon监控系统相似的实现是Prometheus。现在最常见的Kubernetes容器管理系统中,通常会搭配Prometheus进行监控。
https://prometheus.io
https://github.com/prometheus
Prometheus 特点:
• 多维数据模型:由度量名称和键值对标识的时间序列数据
• PromSQL:一种灵活的查询语言,可以利用多维数据完成复杂的查询
• 不依赖分布式存储,单个服务器节点可直接工作
• 基于HTTP的pull方式采集时间序列数据
• 推送时间序列数据通过PushGateway组件支持
• 通过服务发现或静态配置发现目标
• 多种图形模式及仪表盘支持(grafana)
Prometheus 组成及架构:
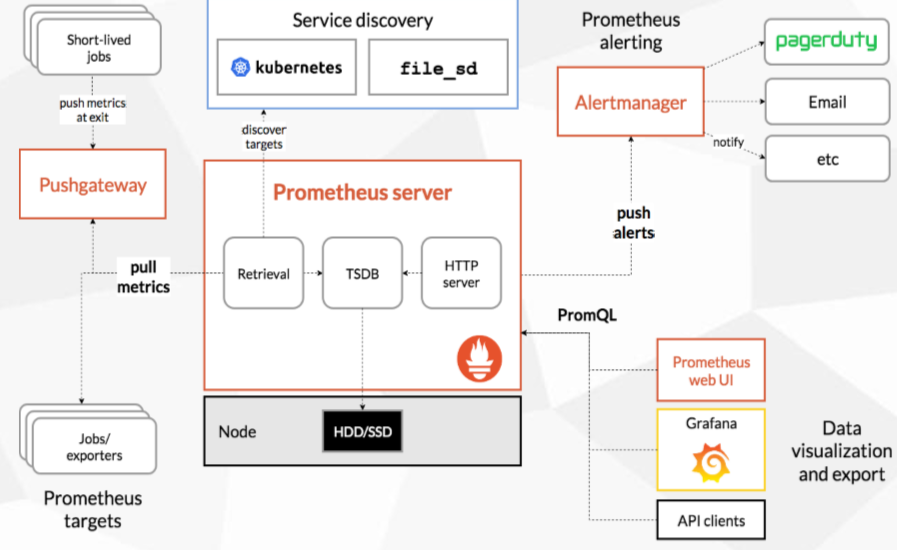
• Prometheus Server:收集指标和存储时间序列数据,并提供查询接口
• ClientLibrary:客户端库
• Push Gateway:短期存储指标数据。主要用于临时性的任务
• Exporters:采集已有的第三方服务监控指标并暴露metrics
• Alertmanager:告警
• Web UI:简单的Web控制
Prometheus 部署
二进制部署:https://prometheus.io/docs/prometheus/latest/getting_started/
Docker部署:https://prometheus.io/docs/prometheus/latest/installation/
以下部署均在两台机器上:
| 主机 | ip地址 | 软件 |
|---|---|---|
| master | 10.200.13.50 | prometheus+Alertmanager+grafana |
| node | 10.200.13.55 | node_exporter |
- Prometheus Server: 普罗米修斯的主服务器。(端口:9090)
- NodeEXporter: 负责收集Host硬件信息和操作系统信息。(端口:9100)
- cAdvisor: 负责收集Host上运行的容器信息。(端口:8080)
- Grafana:负责展示普罗米修斯监控界面。(端口:3000)
- Alertmanager:用来接收Prometheus发送的报警信息,并且执行设置好的报警方式,报警内容(同样也是在dockerA主机上部署,端口:9093);
• 安装Prometheus
tar -zxvf prometheus-2.24.1.linux-amd64.tar.gz -C /usr/local/
cd /usr/local/ && mv prometheus-2.17.1.linux-amd64 prometheus && cd prometheus
•system系统启动Prometheus
cat /usr/lib/systemd/system/prometheus.service
[Unit]
Description=prometheus
After=network.target
[Service]
Type=simple
User=root
ExecStart=/usr/local/prometheus/prometheus --config.file=/usr/local/prometheus/prometheus.yml --storage.tsdb.path=/data/prometheus --storage.tsdb.retention=15d --log.level=info
Restart=on-failure
[Install]
WantedBy=multi-user.target
systemctl daemon-reload
systemctl start prometheus
systemctl enable prometheus
netstat -lntp | grep prometheus
• 安装node_exporter
wget -c https://github.com/prometheus/node_exporter/releases/download/v1.0.1/node_exporter-1.0.1.linux-amd64.tar.gz
tar -zxvf node_exporter-1.0.1.linux-amd64.tar.gz -C /usr/local/
cd /usr/local && mv node_exporter-1.0.1.linux-amd64 node_exporter
•system系统启动node_exproter
cat /usr/lib/systemd/system/node_exporter.service
[Unit]
Description=node_exporter
Documentation=https://prometheus.io/
After=network.target
[Service]
Type=simple
User=root
ExecStart=/usr/local/node_exporter/node_exporter
Restart=on-failure
[Install]
WantedBy=multi-user.target
systemctl daemon-reload
systemctl start node_exporter
systemctl enable node_exporter
ps -ef | grep node_exporter
• 修改/添加配置文件prometheus.yml
my global config
global:
scrape_interval: 15s # Set the scrape interval to every 15 seconds. Default is every 1 minute.
evaluation_interval: 15s # Evaluate rules every 15 seconds. The default is every 1 minute.
# scrape_timeout is set to the global default (10s).
Alertmanager configuration
alerting:
alertmanagers:
- static_configs:
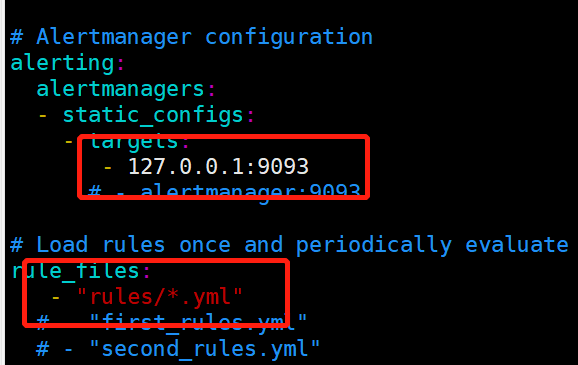
- targets:
- 127.0.0.1:9093
# - alertmanager:9093
Load rules once and periodically evaluate them according to the global 'evaluation_interval'.
rule_files:
- "rules/*.yml"
# - "first_rules.yml"
# - "second_rules.yml"
A scrape configuration containing exactly one endpoint to scrape:
Here it's Prometheus itself.
scrape_configs:
# The job name is added as a label job=<job_name> to any timeseries scraped from this config.
- job_name: 'prometheus'
metrics_path defaults to '/metrics'
scheme defaults to 'http'.
static_configs:
- targets: ['localhost:9090'] # 如果对本机node_exporter监控,加入,'localhost:9100'
- job_name: '13.55'
#重写了全局抓取间隔时间,由15秒重写成5秒。
scrape_interval: 5s
static_configs:
- targets: ['10.200.13.55:9100']
•检查prometheus.yml配置是否有效
[root@k8s-master prometheus]# pwd
/usr/local/prometheus
[root@k8s-master prometheus]# ./promtool check config prometheus.yml
Checking prometheus.yml
SUCCESS: 0 rule files found
可以正常访问http://10.200.13.50:9090/targets
Grafana安装
wget https://dl.grafana.com/oss/release/grafana-7.3.7-1.x86_64.rpm
yum install grafana-7.3.7-1.x86_64.rpm
systemctl start grafana-server.service
systemctl enable grafana-server.service
netstat -lntp | grep grafana-server
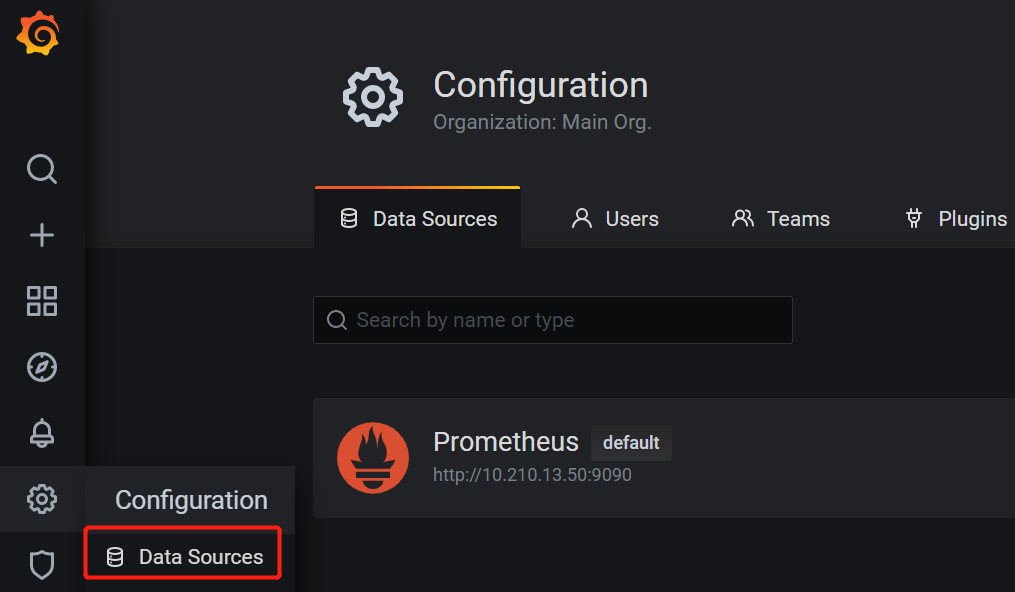
•访问http://10.200.13.50:3000/ 添加data sources,点击添加选择prometheus即可
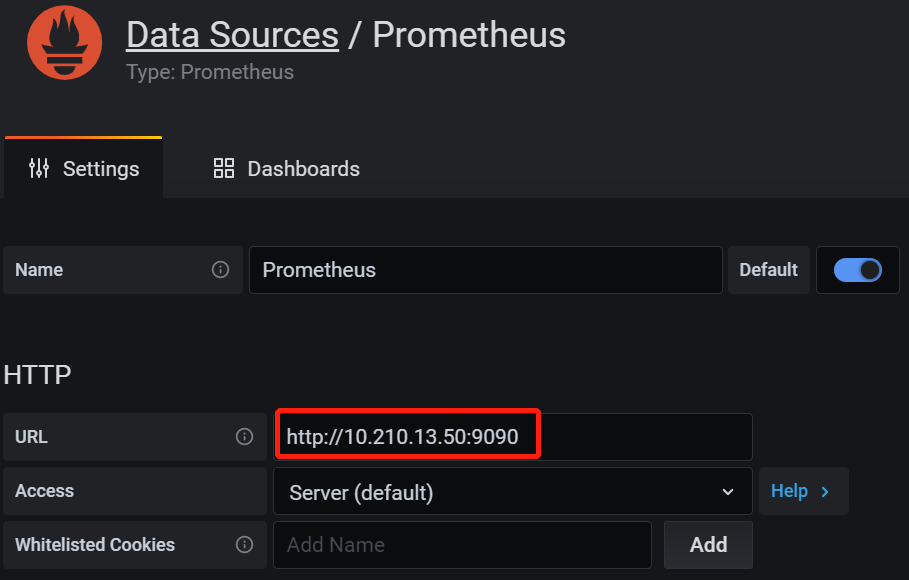
•添加配置信息,写入prometheus的URL,点击“Save&Test”提示绿色成功
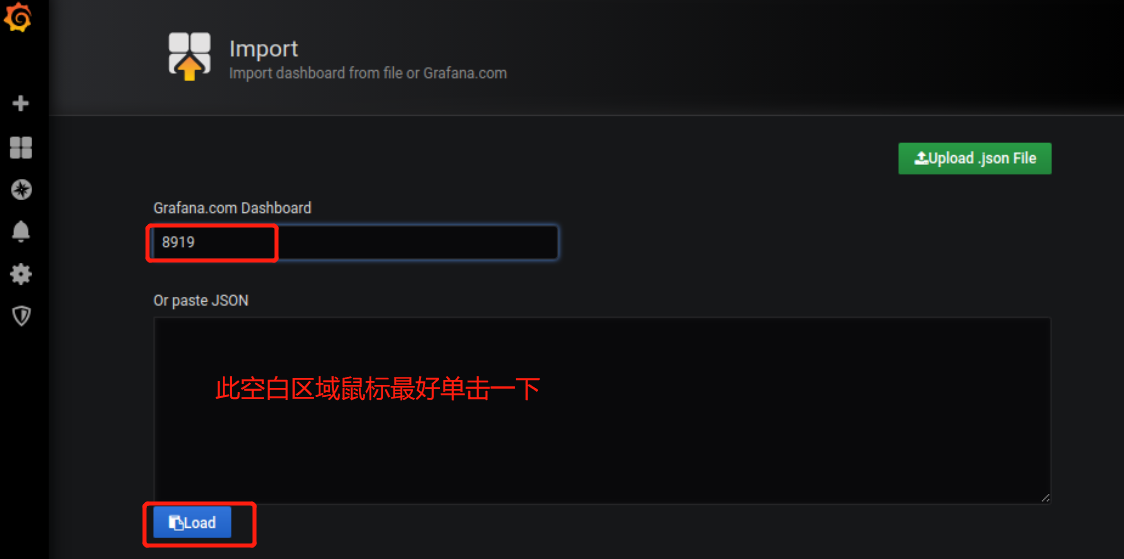
配置grafana-node_exporter仪表版
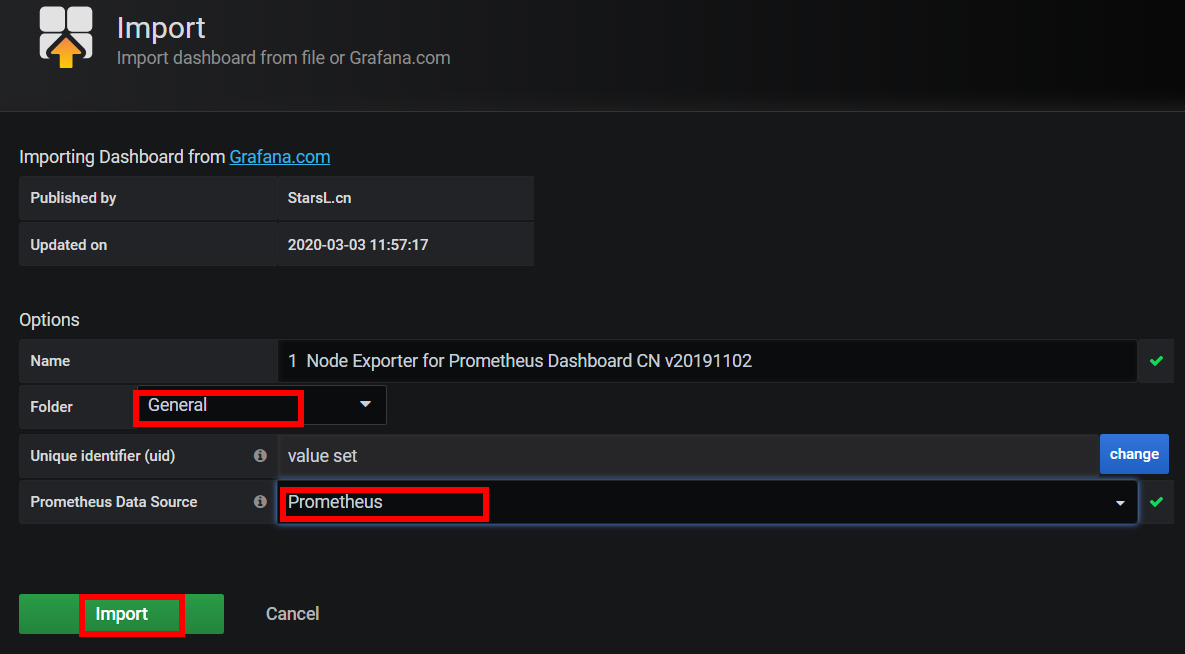
•导入Prometheus仪表盘,import-dashboards
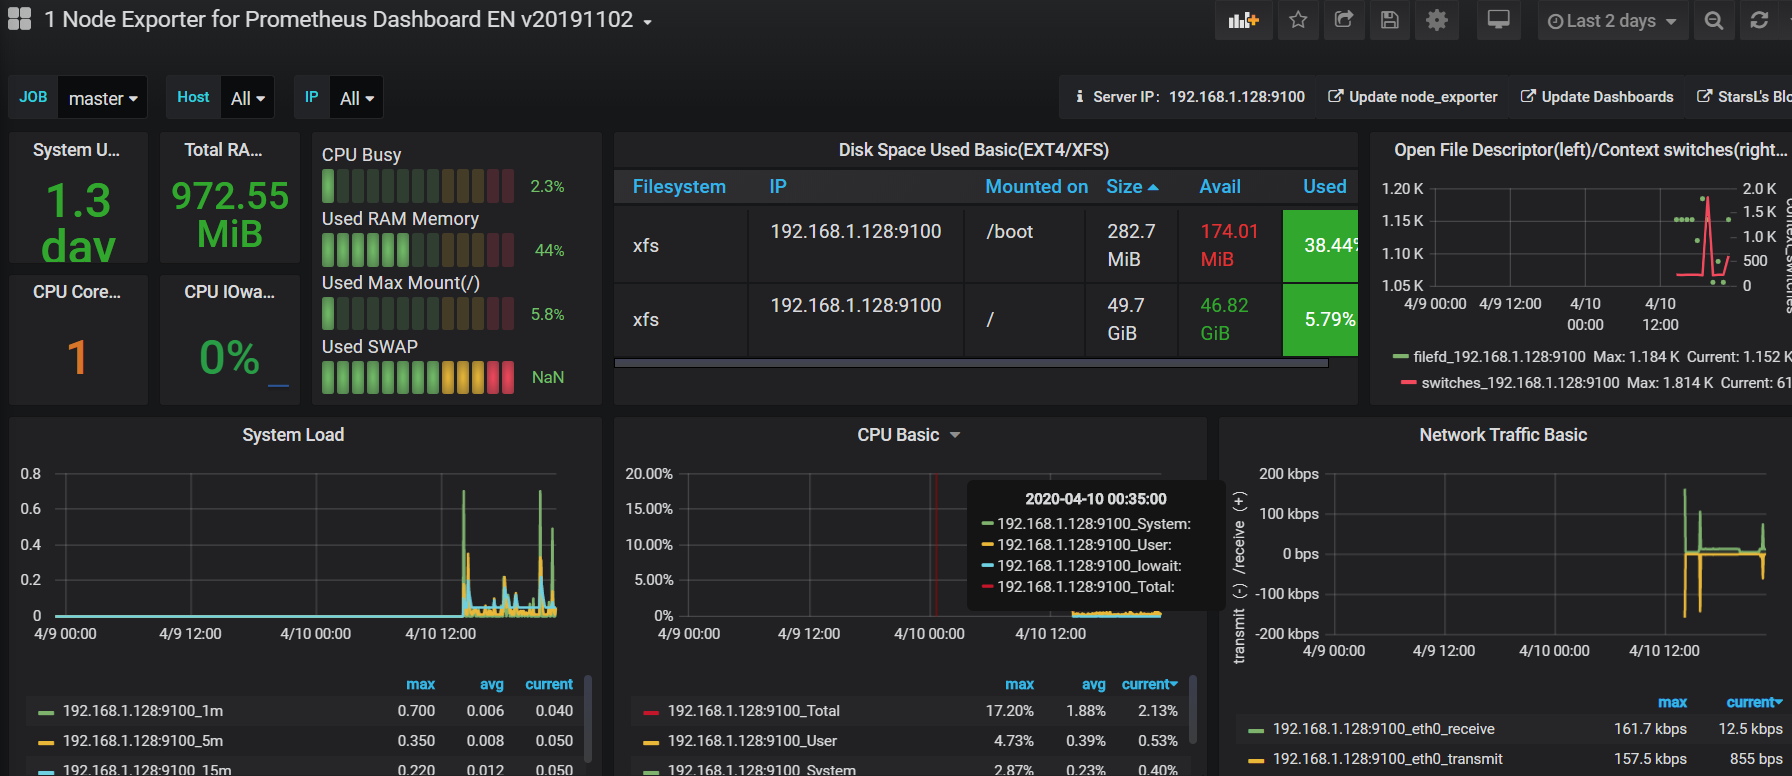
•进入仪表板查看
Altermanager监控告警
地址1:https://prometheus.io/download/
地址2:https://github.com/prometheus/alertmanager/releases
实现prometheus的告警,需要通过altermanager这个组件;在prometheus服务端写告警规则,在altermanager组件配置企业微信
Alertmanager与Prometheus是相互分离的两个组件。Prometheus服务器根据报警规则将警报发送给Alertmanager,然后Alertmanager将silencing、inhibition、aggregation等消息通过电子邮件、dingtalk和HipChat发送通知。
Alertmanager处理由例如Prometheus服务器等客户端发来的警报。它负责删除重复数据、分组,并将警报通过路由发送到正确的接收器,比如电子邮件、Slack、dingtalk等。Alertmanager还支持groups,silencing和警报抑制的机制。
•安装altermanager
wget https://github.com/prometheus/alertmanager/releases/download/v0.21.0/alertmanager-0.21.0.linux-amd64.tar.gz # 下载altermanager
tar xvf alertmanager-0.21.0.linux-amd64.tar.gz -C /usr/local/ #解压至指定文件夹
cd /usr/local/ && mv alertmanager-0.21.0.linux-amd64 alertmanager
cd alertmanager/
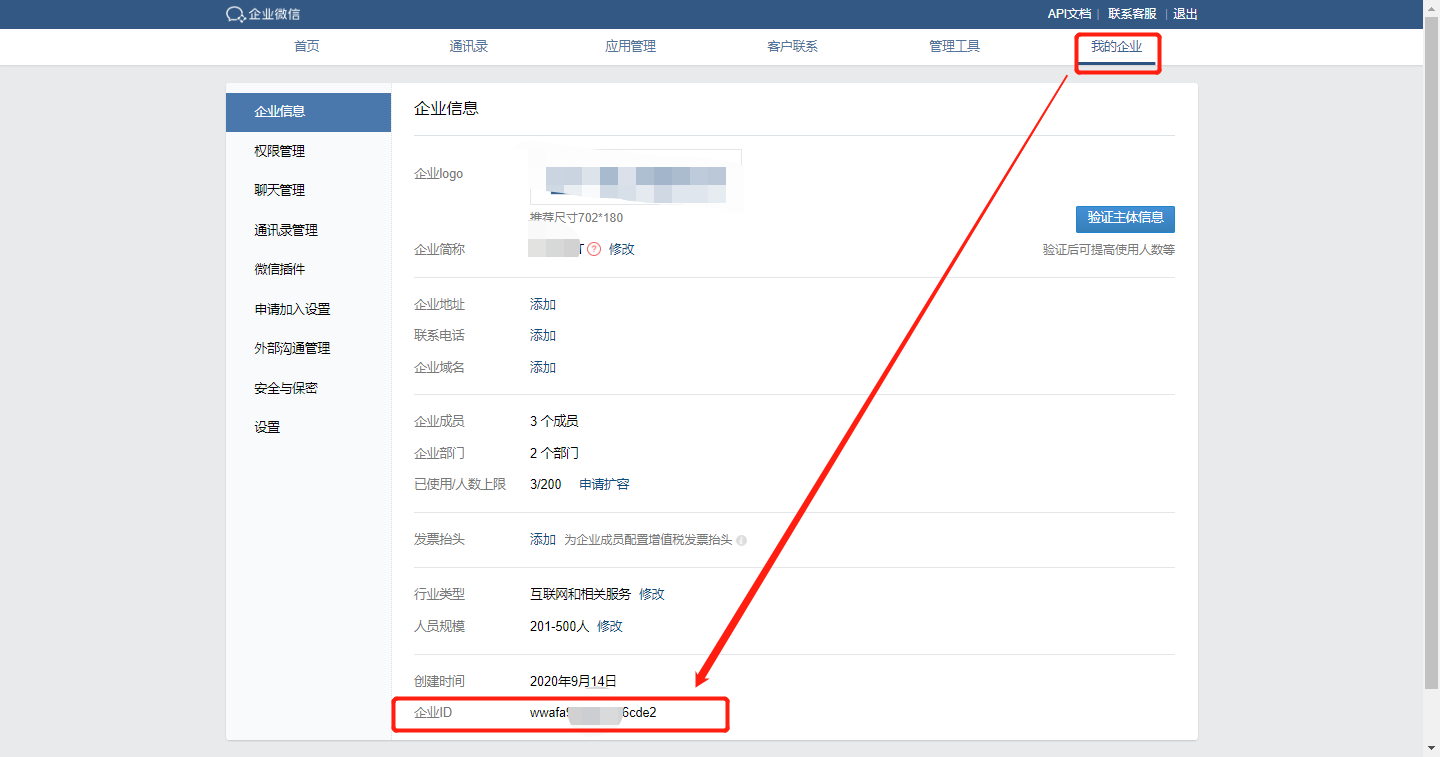
•企业ID获取
登录后台管理,在【我的企业】这里,先拿到后面用到的第一个配置:企业ID
•部门ID获取
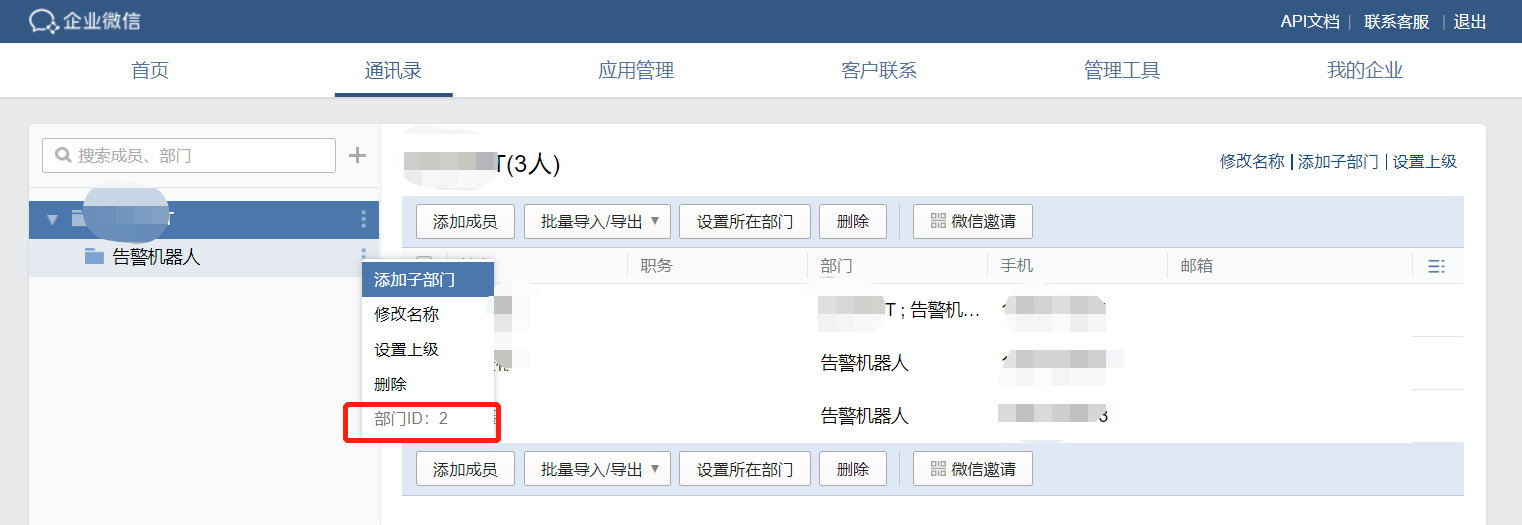
然后在通讯录中,添加一个子部门,用于接收告警信息,后面把人加到该部门,这个人就能接收到告警信息了。
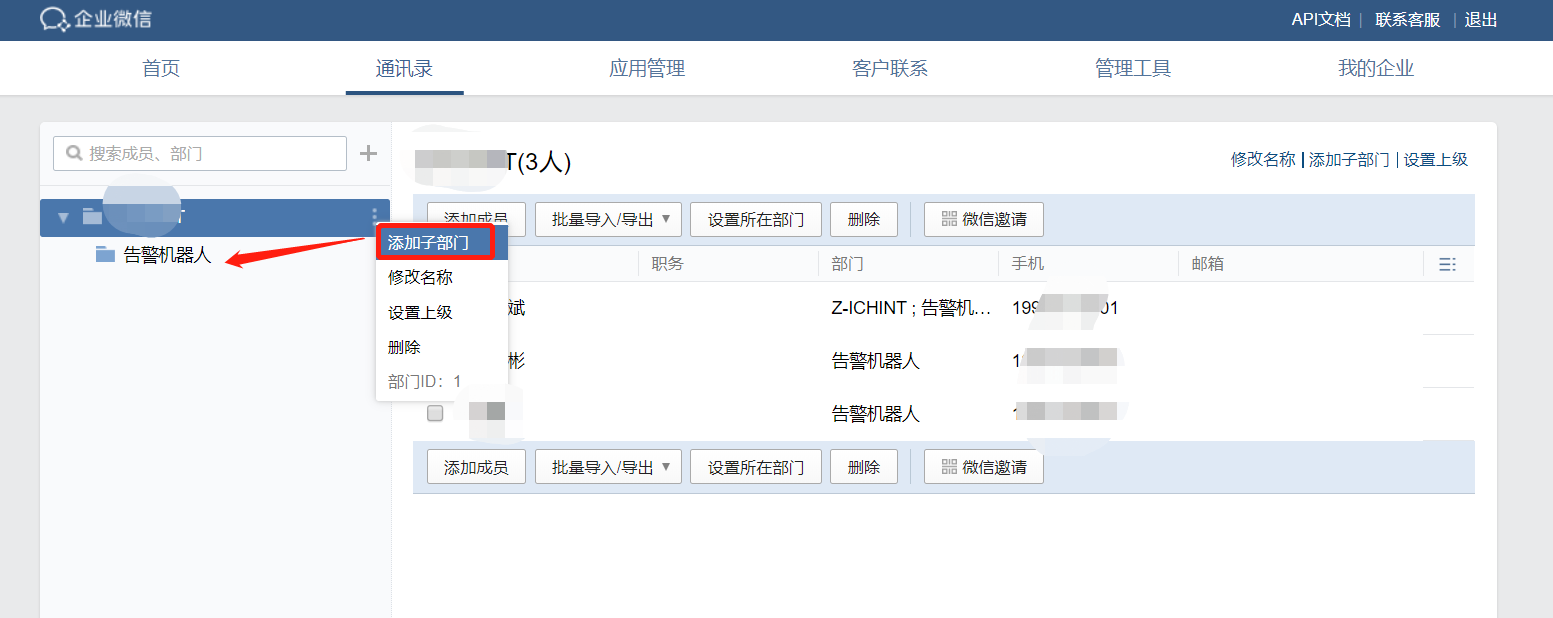
获得我们配置告警的第二个参数:部门ID 2
•告警AgentId和Secret获取
告警AgentId和Secret获取是需要在企业微信后台,【应用管理】中,自建应用才能够获得的。
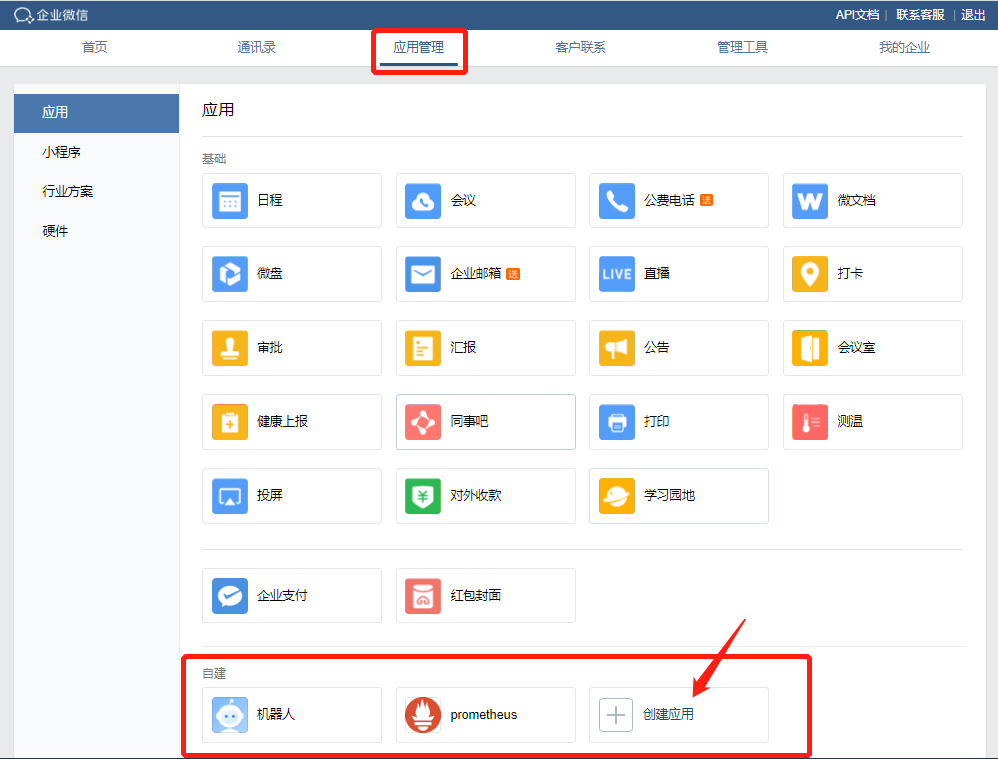
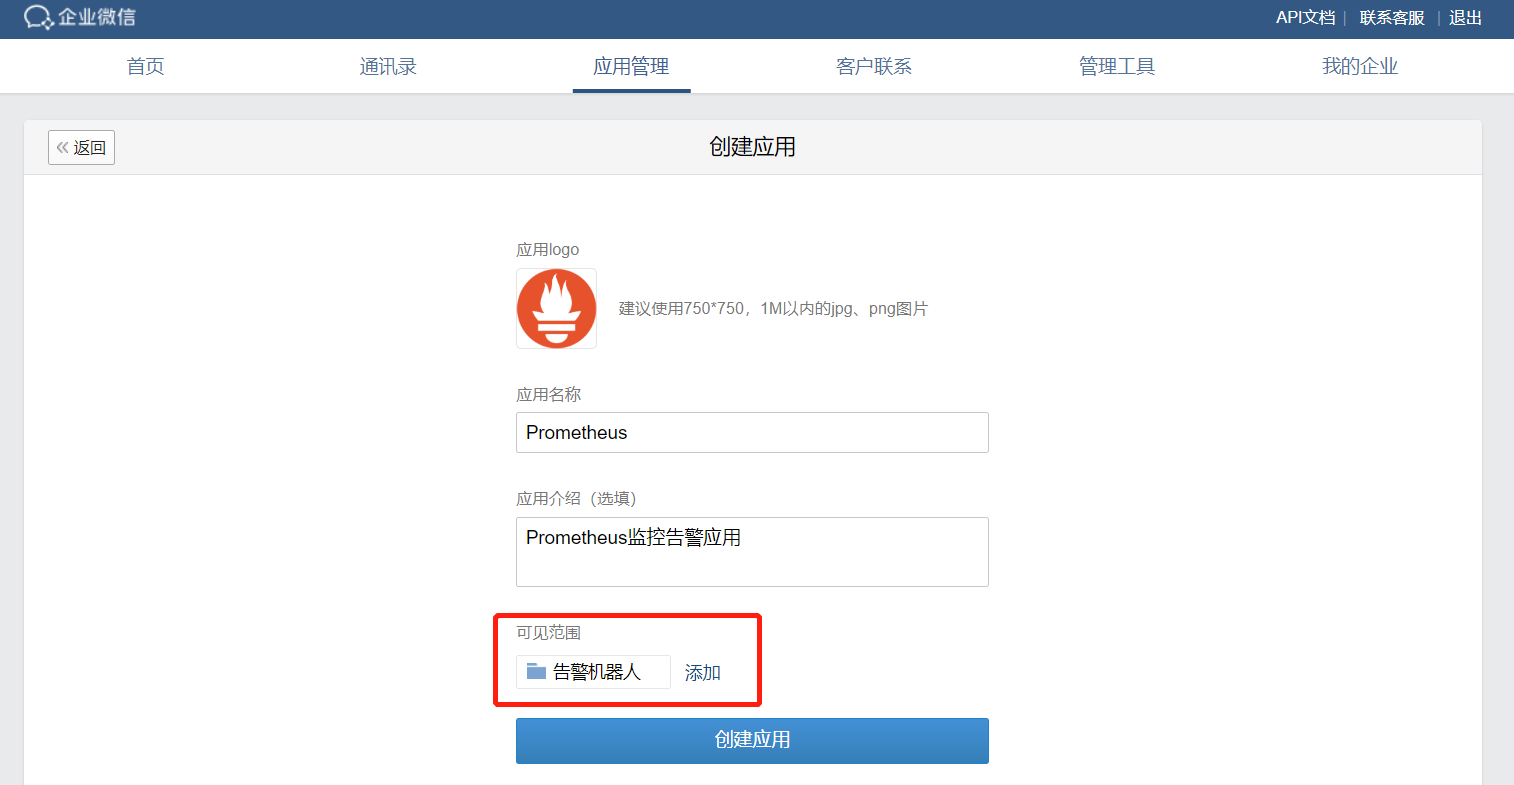
最后点击创建应用,可以看到我们刚才创建好的应用Prometheus。
点击这个应用,可以看到我们想要的AgentId和Secret
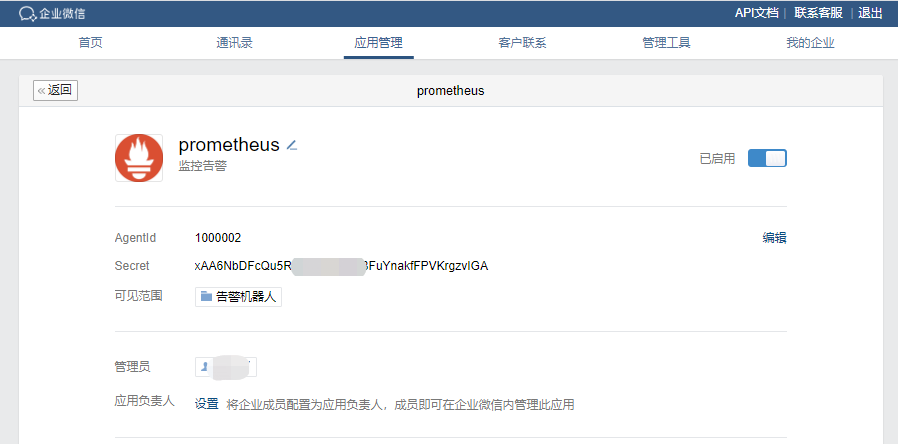
以上步骤完成后,我们就得到了配置Alertmanager的所有信息,包括:企业ID,AgentId,Secret和接收告警的部门id
•编辑alertmanager.yml配置文件
global:
resolve_timeout: 1m # 每1分钟检测一次是否恢复
wechat_api_url: 'https://qyapi.weixin.qq.com/cgi-bin/'
wechat_api_corp_id: '' # 企业微信中企业ID
wechat_api_secret: '' # 企业微信中,应用的Secret
templates:
- '/usr/local/alertmanager/template/.tmpl'
route:
receiver: 'wechat'
group_by: ['env','instance','type','group','job','alertname']
group_wait: 10s # 初次发送告警延时
group_interval: 10s # 距离第一次发送告警,等待多久再次发送告警
repeat_interval: 1h # 告警重发时间
# receiver: 'email'
receivers:
- name: 'wechat'
wechat_configs:
- send_resolved: true
message: '{{ template "wechat.default.message" . }}'
to_party: '2' # 企业微信中创建的接收告警的部门【告警机器人】的部门ID
agent_id: '1000003' # 企业微信中创建的应用的ID
api_secret: '**************************' # 企业微信中,应用的Secret
•system系统启动alertmanager
[Unit]
Description=alertmanager
Documentation=https://github.com/prometheus/alertmanager
After=network.target
[Service]
Type=simple
User=root
ExecStart=/usr/local/alertmanager/alertmanager --config.file=/usr/local/alertmanager/alertmanager.yml --storage.path=/data/alertmanager
Restart=on-failure
[Install]
WantedBy=multi-user.target
•修改prometheus配置文件
•在prometheus/rules路径下创建node_status.yml
groups:
- name: 实例存活告警规则
rules:
- alert: 实例存活告警
expr: up{job="prometheus"} == 0 or up{job="13.55"} == 0
for: 1m
labels:
user: root
severity: Disaster
annotations:
summary: "Instance {{ $labels.instance }} is down"
description: "Instance {{ $labels.instance }} of job {{ $labels.job }} has been down for more than 1 minutes."
value: "{{ $value }}"
- name: 内存告警规则
rules:
- alert: "内存使用率告警"
expr: (node_memory_MemTotal_bytes - (node_memory_MemFree_bytes+node_memory_Buffers_bytes+node_memory_Cached_bytes )) / node_memory_MemTotal_bytes * 100 > 75
for: 1m
labels:
user: root
severity: warning
annotations:
summary: "服务器: {{$labels.alertname}} 内存报警"
description: "{{ $labels.alertname }} 内存资源利用率大于75%!(当前值: {{ $value }}%)"
value: "{{ $value }}"
- name: CPU报警规则
rules:
- alert: CPU使用率告警
expr: 100 - (avg by (instance)(irate(node_cpu_seconds_total{mode="idle"}[1m]) )) * 100 > 70
for: 1m
labels:
user: root
severity: warning
annotations:
summary: "服务器: {{$labels.alertname}} CPU报警"
description: "服务器: CPU使用超过70%!(当前值: {{ $value }}%)"
value: "{{ $value }}"
- name: 磁盘报警规则
rules:
- alert: 磁盘使用率告警
expr: (node_filesystem_size_bytes - node_filesystem_avail_bytes) / node_filesystem_size_bytes * 100 > 80
for: 1m
labels:
user: root
severity: warning
annotations:
summary: "服务器: {{$labels.alertname}} 磁盘报警"
description: "服务器:{{$labels.alertname}},磁盘设备: 使用超过80%!(挂载点: {{ $labels.mountpoint }} 当前值: {{ $value }}%)"
value: "{{ $value }}"
•启动alertmanager
./amtool check-config alertmanager.yml #检查配置是否生效
systemctl daemon-reload #加载并启动服务
systemctl start alertmanager
systemctl enable alertmanager
ps -ef | grep alertmanager
重启prometheus
systemctl start prometheus
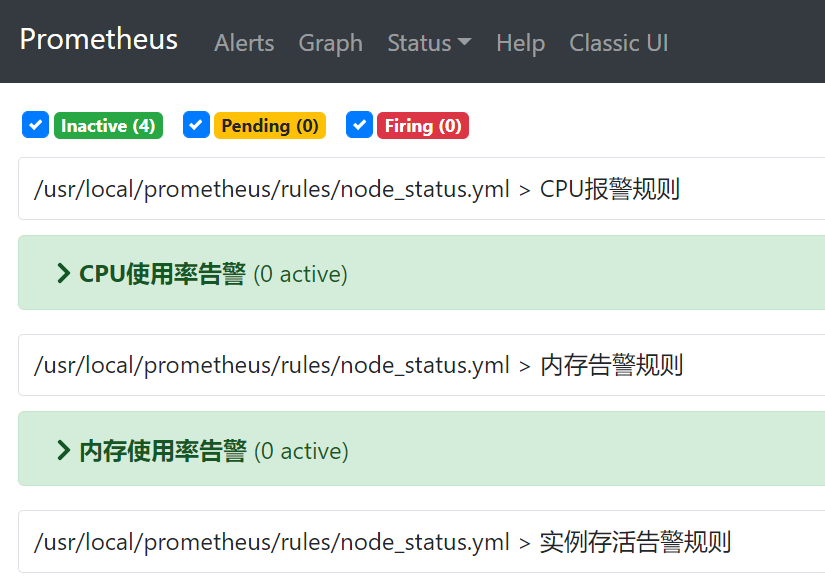
•访问http://10.200.13.50:9090/alerts ,即可查看规则
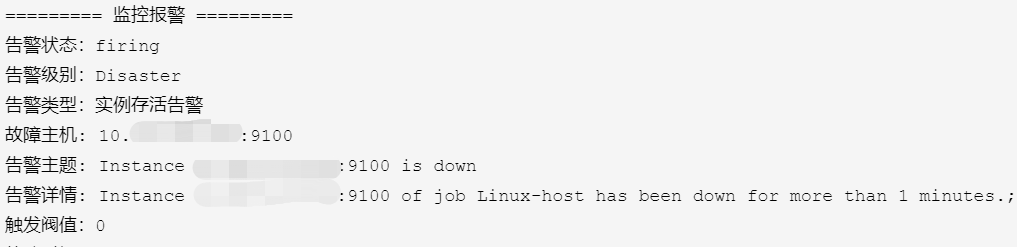
至此,企业Prometheus对接企业微信告警完毕,出现故障你就能看到如下告警信息和恢复信息了

 浙公网安备 33010602011771号