

系统磁盘资源
.磁盘性能监控
1、系统磁盘信息获取:df
2、系统磁盘性能监控:sar和iostat
.磁盘空间限制
系统磁盘信息获取:df
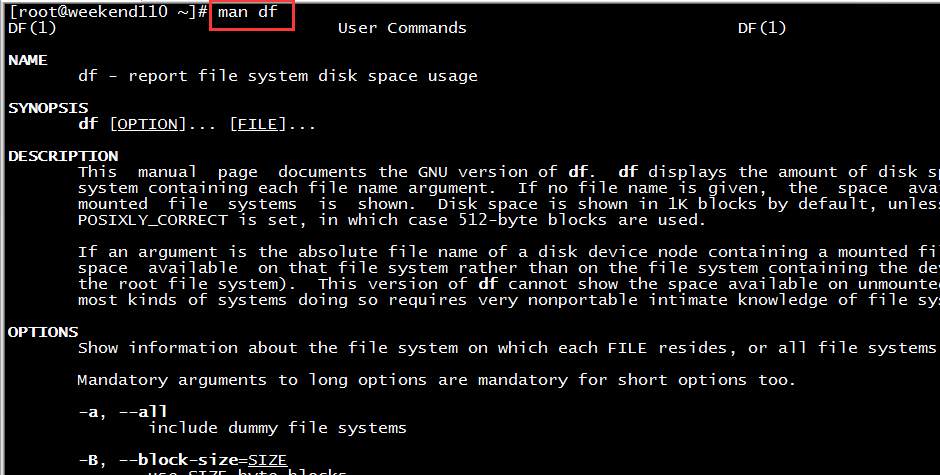
[root@weekend110 ~]# man df
DF(1) User Commands DF(1)
NAME
df - report file system disk space usage
SYNOPSIS
df [OPTION]... [FILE]...
DESCRIPTION
This manual page documents the GNU version of df. df displays the amount of disk space available on the file
system containing each file name argument. If no file name is given, the space available on all currently
mounted file systems is shown. Disk space is shown in 1K blocks by default, unless the environment variable
POSIXLY_CORRECT is set, in which case 512-byte blocks are used.
If an argument is the absolute file name of a disk device node containing a mounted file system, df shows the
space available on that file system rather than on the file system containing the device node (which is always
the root file system). This version of df cannot show the space available on unmounted file systems, because on
most kinds of systems doing so requires very nonportable intimate knowledge of file system structures.
OPTIONS
Show information about the file system on which each FILE resides, or all file systems by default.
Mandatory arguments to long options are mandatory for short options too.
-a, --all
include dummy file systems
-B, --block-size=SIZE
use SIZE-byte blocks
--direct
show statistics for a file instead of mount point
--total
produce a grand total
-h, --human-readable
print sizes in human readable format (e.g., 1K 234M 2G)
-H, --si
likewise, but use powers of 1000 not 1024
-i, --inodes
list inode information instead of block usage
-k like --block-size=1K
-l, --local
limit listing to local file systems
--no-sync
do not invoke sync before getting usage info (default)
-P, --portability
use the POSIX output format
--sync invoke sync before getting usage info
-t, --type=TYPE
limit listing to file systems of type TYPE
-T, --print-type
print file system type
-x, --exclude-type=TYPE
limit listing to file systems not of type TYPE
-v (ignored)
-x, --exclude-type=TYPE
limit listing to file systems not of type TYPE
-v (ignored)
-k like --block-size=1K
-l, --local
limit listing to local file systems
--no-sync
do not invoke sync before getting usage info (default)
-P, --portability
use the POSIX output format
--sync invoke sync before getting usage info
-t, --type=TYPE
limit listing to file systems of type TYPE
-T, --print-type
print file system type
-x, --exclude-type=TYPE
limit listing to file systems not of type TYPE
-v (ignored)
-v (ignored)
-v (ignored)
-v (ignored)
-v (ignored)
-P, --portability
use the POSIX output format
--sync invoke sync before getting usage info
-t, --type=TYPE
limit listing to file systems of type TYPE
-T, --print-type
print file system type
-x, --exclude-type=TYPE
limit listing to file systems not of type TYPE
-v (ignored)
--help display this help and exit
--version
output version information and exit
Display values are in units of the first available SIZE from --block-size, and the DF_BLOCK_SIZE, BLOCK_SIZE and
BLOCKSIZE environment variables. Otherwise, units default to 1024 bytes (or 512 if POSIXLY_CORRECT is set).
SIZE may be (or may be an integer optionally followed by) one of following: KB 1000, K 1024, MB 1000*1000, M
1024*1024, and so on for G, T, P, E, Z, Y.
AUTHOR
Written by Torbjorn Granlund, David MacKenzie, and Paul Eggert.
REPORTING BUGS
Report df bugs to bug-coreutils@gnu.org
GNU coreutils home page: <http://www.gnu.org/software/coreutils/>
General help using GNU software: <http://www.gnu.org/gethelp/>
Report df translation bugs to <http://translationproject.org/team/>
COPYRIGHT
Copyright © 2010 Free Software Foundation, Inc. License GPLv3+: GNU GPL version 3 or later
<http://gnu.org/licenses/gpl.html>.
This is free software: you are free to change and redistribute it. There is NO WARRANTY, to the extent permit-
ted by law.
SEE ALSO
The full documentation for df is maintained as a Texinfo manual. If the info and df programs are properly
installed at your site, the command
info coreutils 'df invocation'
should give you access to the complete manual.
GNU coreutils 8.4 November 2013 DF(1)
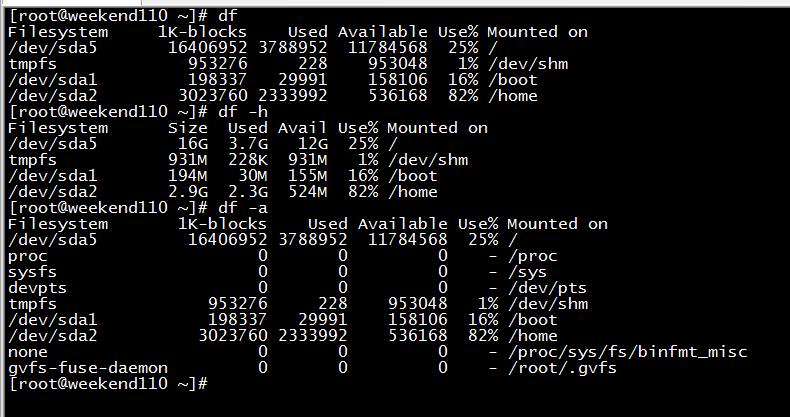
[root@weekend110 ~]# df 常用
Filesystem 1K-blocks Used Available Use% Mounted on
/dev/sda5 16406952 3788952 11784568 25% /
tmpfs 953276 228 953048 1% /dev/shm
/dev/sda1 198337 29991 158106 16% /boot
/dev/sda2 3023760 2333992 536168 82% /home
[root@weekend110 ~]# df -h 常用
Filesystem Size Used Avail Use% Mounted on
/dev/sda5 16G 3.7G 12G 25% /
tmpfs 931M 228K 931M 1% /dev/shm
/dev/sda1 194M 30M 155M 16% /boot
/dev/sda2 2.9G 2.3G 524M 82% /home
[root@weekend110 ~]# df -a 常用
Filesystem 1K-blocks Used Available Use% Mounted on
/dev/sda5 16406952 3788952 11784568 25% /
proc 0 0 0 - /proc
sysfs 0 0 0 - /sys
devpts 0 0 0 - /dev/pts
tmpfs 953276 228 953048 1% /dev/shm
/dev/sda1 198337 29991 158106 16% /boot
/dev/sda2 3023760 2333992 536168 82% /home
none 0 0 0 - /proc/sys/fs/binfmt_misc
gvfs-fuse-daemon 0 0 0 - /root/.gvfs
[root@weekend110 ~]#
df -a 显示所有文件系统的磁盘空间的使用情况
df -k 以KB为单位显示
df -t 显示指定类型的文件系统的磁盘空间的使用信息
df -x 显示不指定类型的文件系统的磁盘空间的使用信息
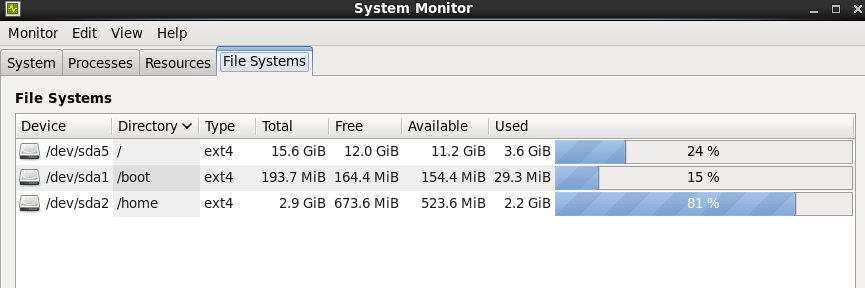
当然,也可在图形界面里,查看,即System Monitor窗口。
系统磁盘、系统分区、及其他信息获取:fdisk

[root@weekend110 ~]# fdisk -l /dev/sda 当然,若有另外的磁盘的话,则 fdisk -l /dev/sdb
Disk /dev/sda: 21.5 GB, 21474836480 bytes
255 heads, 63 sectors/track, 2610 cylinders
Units = cylinders of 16065 * 512 = 8225280 bytes
Sector size (logical/physical): 512 bytes / 512 bytes
I/O size (minimum/optimal): 512 bytes / 512 bytes
Disk identifier: 0x000491de
Device Boot Start End Blocks Id System
/dev/sda1 * 1 26 204800 83 Linux
Partition 1 does not end on cylinder boundary.
/dev/sda2 26 409 3072000 83 Linux
Partition 2 does not end on cylinder boundary.
/dev/sda3 409 536 1024000 82 Linux swap / Solaris
Partition 3 does not end on cylinder boundary.
/dev/sda4 536 2611 16669696 5 Extended
/dev/sda5 536 2611 16668672 83 Linux
系统磁盘性能监控:sar和iostat
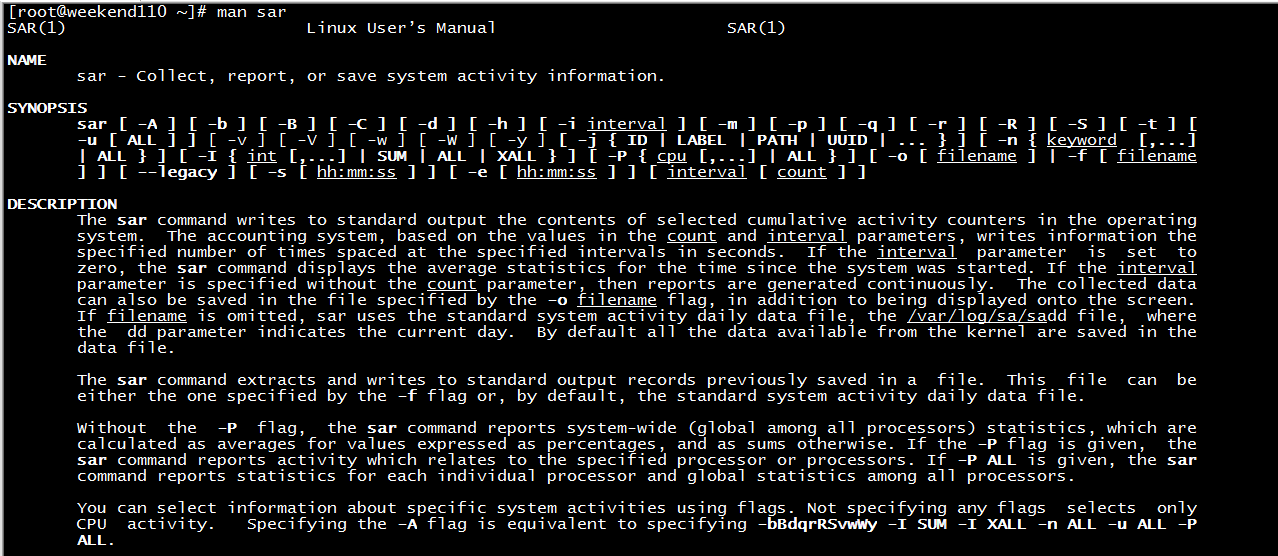
[root@weekend110 ~]# man sar
SAR(1) Linux User’s Manual SAR(1)
NAME
sar - Collect, report, or save system activity information.
SYNOPSIS
sar [ -A ] [ -b ] [ -B ] [ -C ] [ -d ] [ -h ] [ -i interval ] [ -m ] [ -p ] [ -q ] [ -r ] [ -R ] [ -S ] [ -t ] [
-u [ ALL ] ] [ -v ] [ -V ] [ -w ] [ -W ] [ -y ] [ -j { ID | LABEL | PATH | UUID | ... } ] [ -n { keyword [,...]
| ALL } ] [ -I { int [,...] | SUM | ALL | XALL } ] [ -P { cpu [,...] | ALL } ] [ -o [ filename ] | -f [ filename
] ] [ --legacy ] [ -s [ hh:mm:ss ] ] [ -e [ hh:mm:ss ] ] [ interval [ count ] ]
DESCRIPTION
The sar command writes to standard output the contents of selected cumulative activity counters in the operating
system. The accounting system, based on the values in the count and interval parameters, writes information the
specified number of times spaced at the specified intervals in seconds. If the interval parameter is set to
zero, the sar command displays the average statistics for the time since the system was started. If the interval
parameter is specified without the count parameter, then reports are generated continuously. The collected data
can also be saved in the file specified by the -o filename flag, in addition to being displayed onto the screen.
If filename is omitted, sar uses the standard system activity daily data file, the /var/log/sa/sadd file, where
the dd parameter indicates the current day. By default all the data available from the kernel are saved in the
data file.
The sar command extracts and writes to standard output records previously saved in a file. This file can be
either the one specified by the -f flag or, by default, the standard system activity daily data file.
Without the -P flag, the sar command reports system-wide (global among all processors) statistics, which are
calculated as averages for values expressed as percentages, and as sums otherwise. If the -P flag is given, the
sar command reports activity which relates to the specified processor or processors. If -P ALL is given, the sar
command reports statistics for each individual processor and global statistics among all processors.
You can select information about specific system activities using flags. Not specifying any flags selects only
CPU activity. Specifying the -A flag is equivalent to specifying -bBdqrRSvwWy -I SUM -I XALL -n ALL -u ALL -P
ALL.
The default version of the sar command (CPU utilization report) might be one of the first facilities the user
runs to begin system activity investigation, because it monitors major system resources. If CPU utilization is
near 100 percent (user + nice + system), the workload sampled is CPU-bound.
If multiple samples and multiple reports are desired, it is convenient to specify an output file for the sar
command. Run the sar command as a background process. The syntax for this is:
sar -o datafile interval count >/dev/null 2>&1 &
All data is captured in binary form and saved to a file (datafile). The data can then be selectively displayed
with the sar command using the -f option. Set the interval and count parameters to select count records at
interval second intervals. If the count parameter is not set, all the records saved in the file will be
selected. Collection of data in this manner is useful to characterize system usage over a period of time and
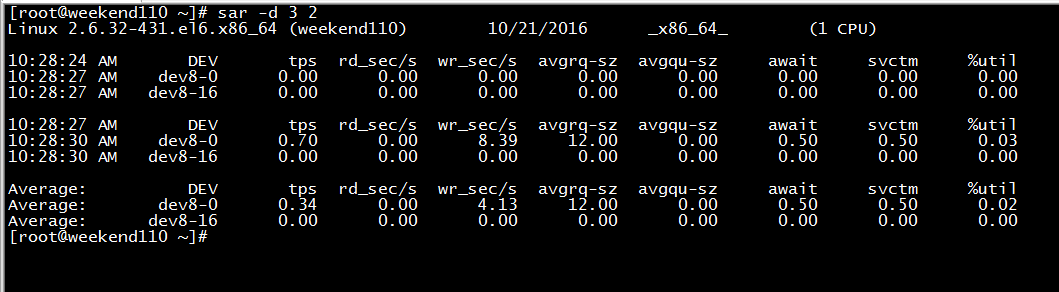
Linux 2.6.32-431.el6.x86_64 (weekend110) 10/21/2016 _x86_64_ (1 CPU)是系统内核版本信息及主机名,接着是sar运行的日期
DEV是磁盘设备名
tps是表示每秒IO传输的数据
rd_sec/s是表示每秒读出的数据
Wr-secs是每秒写入的数据
[root@weekend110 ~]# sar -d 3 2 //3表示输出3次,2表示2秒输出一次
Linux 2.6.32-431.el6.x86_64 (weekend110) 10/21/2016 _x86_64_ (1 CPU)
10:28:24 AM DEV tps rd_sec/s wr_sec/s avgrq-sz avgqu-sz await svctm %util
10:28:27 AM dev8-0 0.00 0.00 0.00 0.00 0.00 0.00 0.00 0.00
10:28:27 AM dev8-16 0.00 0.00 0.00 0.00 0.00 0.00 0.00 0.00
10:28:27 AM DEV tps rd_sec/s wr_sec/s avgrq-sz avgqu-sz await svctm %util
10:28:30 AM dev8-0 0.70 0.00 8.39 12.00 0.00 0.50 0.50 0.03
10:28:30 AM dev8-16 0.00 0.00 0.00 0.00 0.00 0.00 0.00 0.00
Average: DEV tps rd_sec/s wr_sec/s avgrq-sz avgqu-sz await svctm %util
Average: dev8-0 0.34 0.00 4.13 12.00 0.00 0.50 0.50 0.02
Average: dev8-16 0.00 0.00 0.00 0.00 0.00 0.00 0.00 0.00
[root@weekend110 ~]#
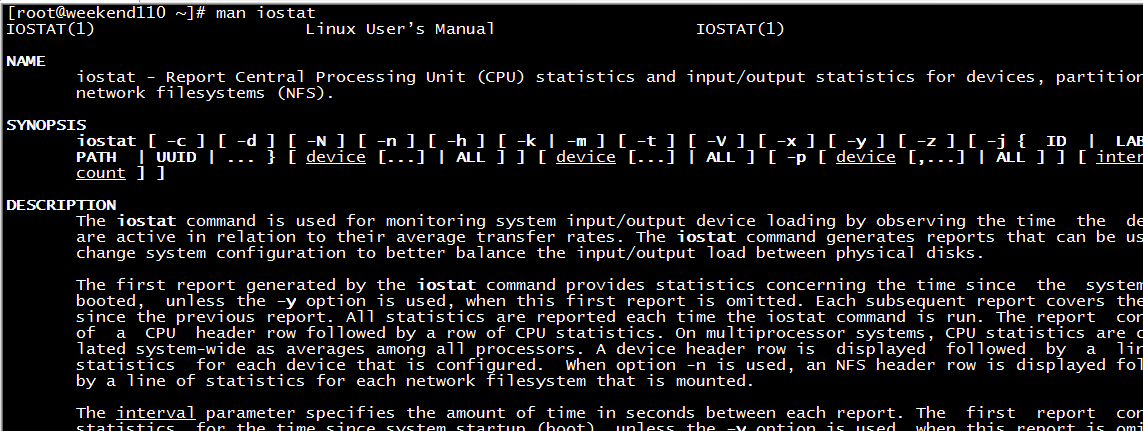
[root@weekend110 ~]# man iostat
IOSTAT(1) Linux User’s Manual IOSTAT(1)
NAME
iostat - Report Central Processing Unit (CPU) statistics and input/output statistics for devices, partitions and
network filesystems (NFS).
SYNOPSIS
iostat [ -c ] [ -d ] [ -N ] [ -n ] [ -h ] [ -k | -m ] [ -t ] [ -V ] [ -x ] [ -y ] [ -z ] [ -j { ID | LABEL |
PATH | UUID | ... } [ device [...] | ALL ] ] [ device [...] | ALL ] [ -p [ device [,...] | ALL ] ] [ interval [
count ] ]
DESCRIPTION
The iostat command is used for monitoring system input/output device loading by observing the time the devices
are active in relation to their average transfer rates. The iostat command generates reports that can be used to
change system configuration to better balance the input/output load between physical disks.
The first report generated by the iostat command provides statistics concerning the time since the system was
booted, unless the -y option is used, when this first report is omitted. Each subsequent report covers the time
since the previous report. All statistics are reported each time the iostat command is run. The report consists
of a CPU header row followed by a row of CPU statistics. On multiprocessor systems, CPU statistics are calcu-
lated system-wide as averages among all processors. A device header row is displayed followed by a line of
statistics for each device that is configured. When option -n is used, an NFS header row is displayed followed
by a line of statistics for each network filesystem that is mounted.
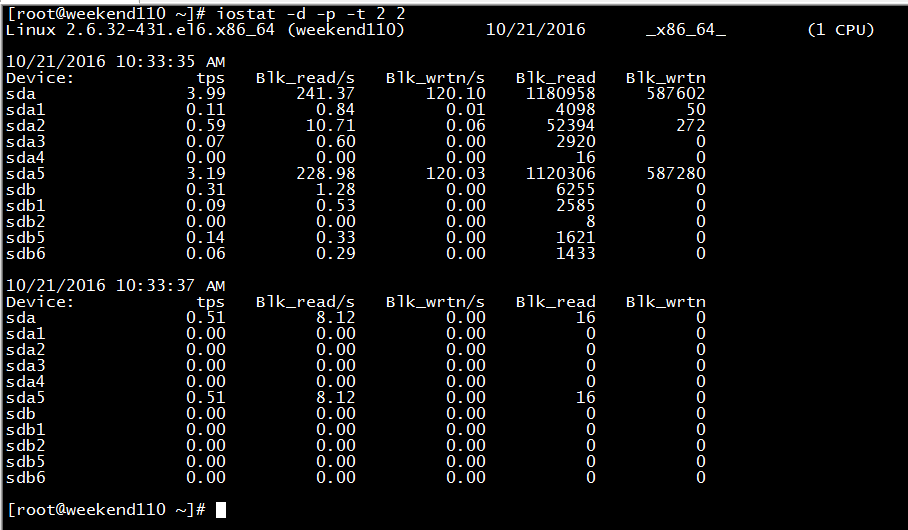
Blk_read/s是每秒从磁盘中读出数据的字节数
Blk_wrtn/s是每秒写入磁盘数据的字节数
Blk_read是从磁盘中读出数据的总字节数
Blk_wrtn是写入磁盘数据的总字节数
[root@weekend110 ~]# iostat -d -p -t 2 2 第一个2是每隔2秒输出一次,后一个2是共输出2次
Linux 2.6.32-431.el6.x86_64 (weekend110) 10/21/2016 _x86_64_ (1 CPU)
10/21/2016 10:33:35 AM
Device: tps Blk_read/s Blk_wrtn/s Blk_read Blk_wrtn
sda 3.99 241.37 120.10 1180958 587602
sda1 0.11 0.84 0.01 4098 50
sda2 0.59 10.71 0.06 52394 272
sda3 0.07 0.60 0.00 2920 0
sda4 0.00 0.00 0.00 16 0
sda5 3.19 228.98 120.03 1120306 587280
sdb 0.31 1.28 0.00 6255 0
sdb1 0.09 0.53 0.00 2585 0
sdb2 0.00 0.00 0.00 8 0
sdb5 0.14 0.33 0.00 1621 0
sdb6 0.06 0.29 0.00 1433 0
10/21/2016 10:33:37 AM
Device: tps Blk_read/s Blk_wrtn/s Blk_read Blk_wrtn
sda 0.51 8.12 0.00 16 0
sda1 0.00 0.00 0.00 0 0
sda2 0.00 0.00 0.00 0 0
sda3 0.00 0.00 0.00 0 0
sda4 0.00 0.00 0.00 0 0
sda5 0.51 8.12 0.00 16 0
sdb 0.00 0.00 0.00 0 0
sdb1 0.00 0.00 0.00 0 0
sdb2 0.00 0.00 0.00 0 0
sdb5 0.00 0.00 0.00 0 0
sdb6 0.00 0.00 0.00 0 0
[root@weekend110 ~]#
iostat -d 只显示磁盘传输的数据信息
iostat -p 显示每个分区的统计信息
iostat -t 每次输出结果时显示时间
iostat -x 显示扩展磁盘分区信息
如果,不对整个磁盘,只是想对某个具体的磁盘,如/dev/sda,则。
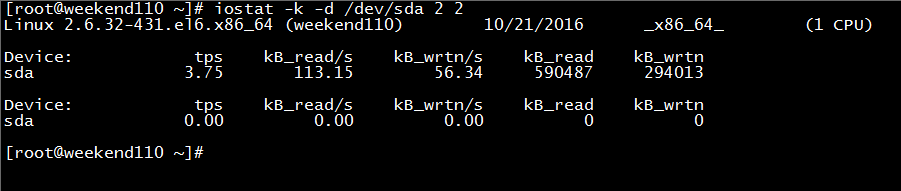
[root@weekend110 ~]# iostat -k -d /dev/sda 2 2
Linux 2.6.32-431.el6.x86_64 (weekend110) 10/21/2016 _x86_64_ (1 CPU)
Device: tps kB_read/s kB_wrtn/s kB_read kB_wrtn
sda 3.75 113.15 56.34 590487 294013
Device: tps kB_read/s kB_wrtn/s kB_read kB_wrtn
sda 0.00 0.00 0.00 0 0
[root@weekend110 ~]#
磁盘空间限制
我们知道,在linux系统里,难免有些用户占用了大量的系统磁盘空间而导致其他用户无法正常使用磁盘来存储数据等信息的情况。因此,为每个用户分配一定的磁盘空间,不仅可以保证系统奇缺的磁盘空间不被独占,还为其他用户提供一定的磁盘空间进行日常工作的使用。
这里,我就不多赘述了,属于Linux运维的人的事。
作者:大数据和人工智能躺过的坑
出处:http://www.cnblogs.com/zlslch/
本文版权归作者和博客园共有,欢迎转载,但未经作者同意必须保留此段声明,且在文章页面明显位置给出原文链接,否则保留追究法律责任的权利。
如果您认为这篇文章还不错或者有所收获,您可以通过右边的“打赏”功能 打赏我一杯咖啡【物质支持】,也可以点击右下角的【好文要顶】按钮【精神支持】,因为这两种支持都是我继续写作,分享的最大动力!

 浙公网安备 33010602011771号