Echarts mc地图
Echarts mc地图
echarts官网实例:
https://gallery.echartsjs.com/editor.html?c=xSNlA5O-zl
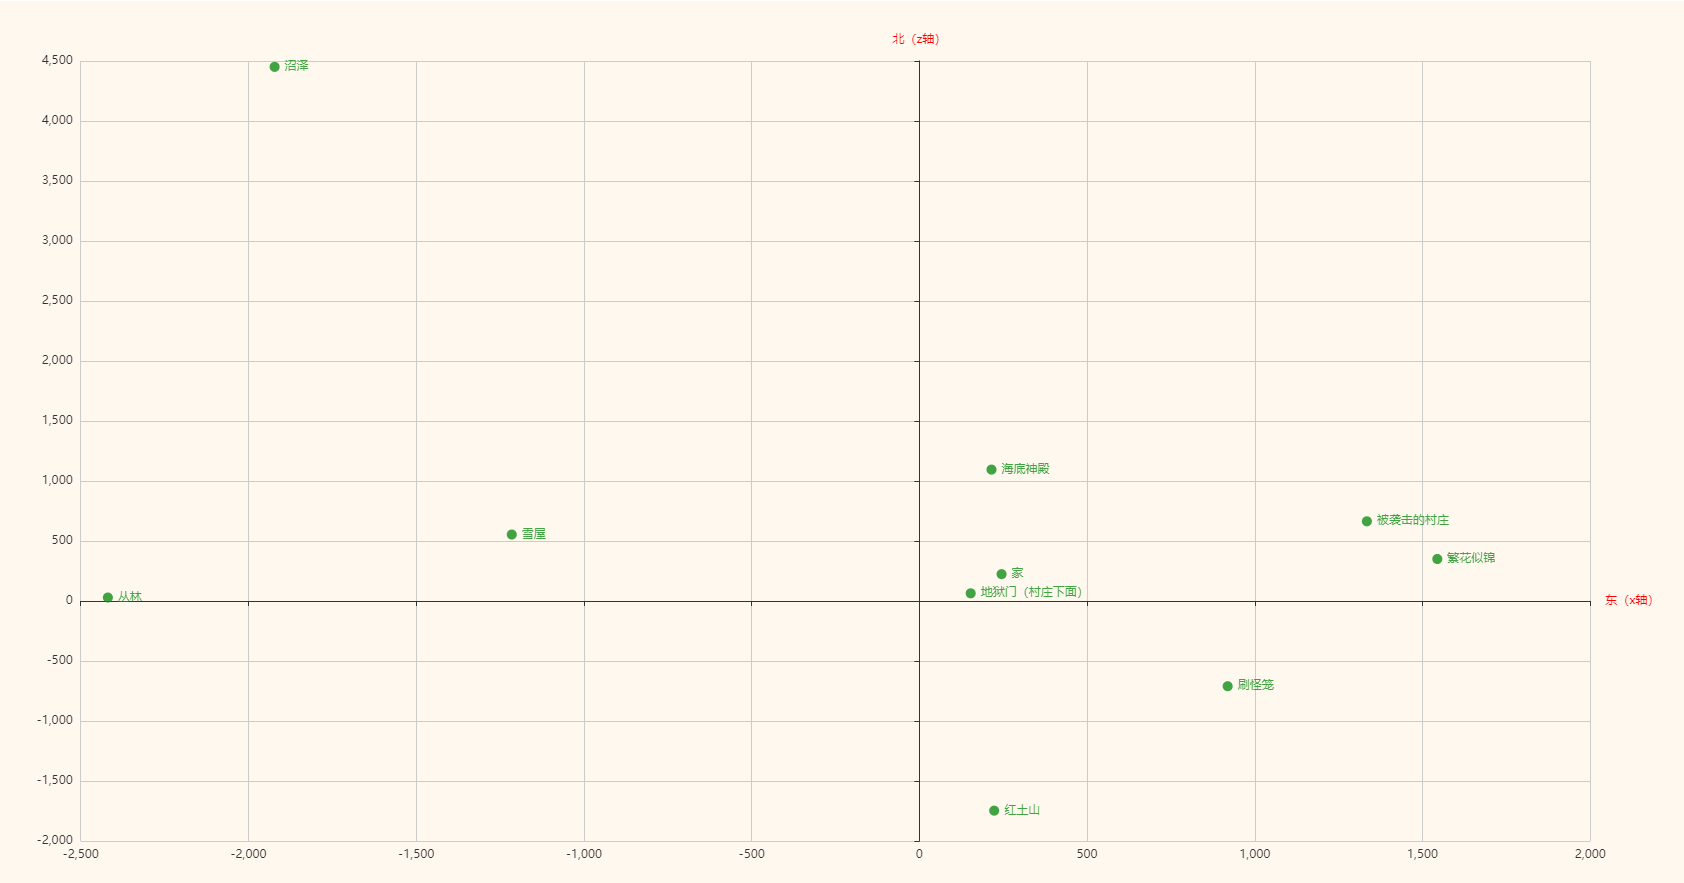
效果:
代码:
<html>
<head>
<script type="text/javascript" src="jquery.min.js"></script>
<script type="text/javascript" src="echarts.min.js"></script>
<script type="text/javascript" src="vintage.js"></script>
</head>
<body>
<div id="container" style="height:900px;"></div>
<script>
var myCharts = echarts.init(document.getElementById('container'),'vintage');
option = {
    color: '#128d15',
    xAxis: {
        name: '东(x轴)',
        maxInterval: 500,
        nameTextStyle: {
            color: '#f00',
        }
    },
    yAxis: {
        name: '北(z轴)',
        maxInterval: 500,
        nameTextStyle: {
            color: '#f00',
        }
    },
    series: [{
        symbolSize: 10,
        label: {
            show: true,
            position: 'right',
            formatter: '{b}',
        },
        data: [{
                name: '家',
                value: [245, 224],
            },
            {
                name: '雪屋',
                value: [-1215, 554],
            },
            {
                name: '繁花似锦',
                value: [1544, 350],
            },
            {
                name: '丛林',
                value: [-2419, 29],
            },
            {
                name: '刷怪笼',
                value: [919, -710],
            },
            {
                name: '被袭击的村庄',
                value: [1334, 664],
            },
            {
                 name: '地狱门(村庄下面)',
                 value: [153, 64],
            },
            {
                name: '红土山',
                value: [223, -1747],
            },
            {
                name: '沼泽',
                value: [-1922, 4451],
            },
            {
                name: '海底神殿',
                value: [215, 1095],
            },

        ],
        type: 'scatter'
    }]
};
myCharts.setOption(option);
</script>
</body>
</html>
使用说明:
//series.data即为自己地图坐标数组
//主题使用vintage,否则背景不为效果所示
//echarts切换主题:
    1.echarts官网下载自己所需要的主题包,这里以vintage为例
    2.引入js
      <script type="text/javascript" src="vintage.js"></script>
    3.初始化echarts时,加入主体标识
      var myCharts = echarts.init(document.getElementById('container'),'vintage');
echarts版本为4.4.0
结束

 浙公网安备 33010602011771号