

看从古至今软件工程的发展,学习最新国内外科研成果。在本文中,旨在通过概括与成果相结合的形式进行对比学习。
从历史上看,当时的程序通常编写者就是使用者,也就是说几乎不会保存文档资料供他人查看,而在这之后很长一段时间大家都使用这种方法,导致软件不可维护,这时候就需要软件工程解决上述问题。我们可以从引入同一变动付出的代价随时间变化的趋势图中得知只有在早期引入变动,涉及的面较少,代价才是最低的,必须重视软件的维护。
而获取高质量的软件不仅仅需要维护,还要合适的软件过程。发展至今,已经出现了许多过程模型来使软件过程具体化,并且各有各的优点。瀑布模型最广为人知,优势在于它是规范的、文档驱动的方法。快速原型模型优势在于通过快速构建的原型系统,让用户试用后获取他们的真实需求。增量模型的优点是可在软件开发的早期阶段获得高收益,软件也容易维护。螺旋模型的优点在于维护和开发并行,减少测试带来的一系列风险。
以下为最新型的敏捷过程。
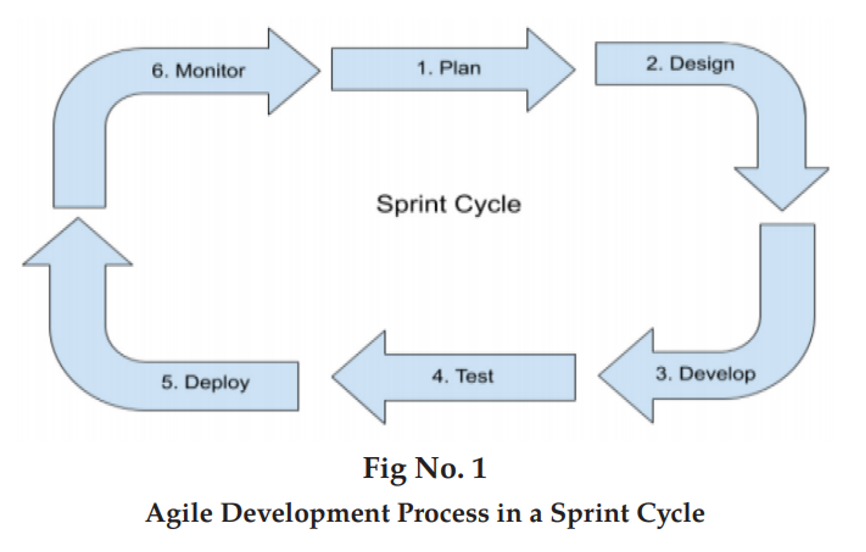
From the Diagram I, there are 6 stages in an agile development process. These 6 stages are completed in 2 to 3 weeks and this time period is called a Sprint.
The sprint starts with a first stage of Plan. In the planning stage the product management conceptualizes a software product or service.
The second stage of agile development process is of Design. In this stage developers, software test engineers and graphic designers work on code architecture, test design and user interface aspects of the software respectively.
Next stage in agile development process is to develop the software application. In this stage developers start programing the software application based on the architectural and User interface designs.
In the next stage, when the software development is complete, it is handed over to the test engineers for testing.
Once the software is deployed, the final stage of the agile software development process is to monitor the released software in production. The aim of monitoring is to learn how the software is behaving in production and if the end, users are able to use the software application without any issues. [1]
可行性研究是第一步,研究技术可行性,经济可行性和操作可行性。画出系统流程图是为了概括地描绘物理系统,确定系统各部件大致框架。接下来的数据流图描绘了软件中数据流动和被处理的逻辑过程,用来使用户和分析员进行更好的沟通。数据字典则是与数据流图共同构成系统的逻辑模型,提供进一步的数据描述信息。成本/效益分析则清晰地展示了投资新系统是否回本以及净利润与成本之比。
软件定义的最后一个阶段是需求分析,分析员需要与用户沟通以获取与引导需求。软件系统的主要综合要求有功能需求、性能需求、可靠性和可用性需求、出错处理需求、接口需求、约束和将来可提出的要求。为使分析结构化,需要建立数据模型、功能模型和行为模型3种模型。实体-联系图描绘数据对象之间的关系,建立数据模型。可用数据流图建立功能模型。状态转换图指明了作为外部事件结果的系统行为,建立最后的行为模型。
到近代,传统的软件工程方法学不能满足于大型开发,面向对象方法学就此登上舞台,并成为人们的首选的范型。用对象模型表示系统静态的、结构化的类数据性质,通常使用UML提供的类图来建立。描述类与类之间的静态关系的符号有关联、聚集、泛化、组合、实现、依赖和细化。系统变化的类功能性质用功能模型表示,通常使用UML提供的用例图来建立。用例图需要注意系统是黑盒,用例是可被行为者感受到的一个完整的功能,行为者代表外部实例,用例之间关系主要有扩展和使用两种。
总体设计则是“由系统如何实现,概括的说”的答案,在全局的高度,尽可能减少成本,抽象分析对比得出最好的软件结构和方案,从而搭建较高质量的软件系统。系统设计阶段与结构设计阶段构成总体设计过程,书写文档为展示与保存设计过程。过程中应当遵循一定设计原理——模块化、逐步求精、信息隐藏和局部化与模块独立,做到低耦合、高内聚。尽量使用软件结构图描绘软件结构,变换分析设计步骤包含数据流图、其第一级分解、其第二级分解与其精化。
需求概述中提取信息,开始了我们组总体设计文档的撰写,分为处理流程、总体结构和模块外部设计、功能分配、接口设计、数据结构设计、运行设计、出错处理设计、安全保密设计和维护设计。较全面地完成了总体设计文档的说明。
精确的描述可以快速编码、具体实现系统是详细设计阶段的目标。其中过程设计的工具显得尤其重要,有程序流程图、盒图、PAD图和判定表。
最后来到编码和测试,即实现。编码风格应该遵循下述规则,程序内部的文档、数据说明、语句构造、输入输出和效率。大型软件系统的测试过程基本上由模块测试、子系统测试、系统测试、验收测试和平行运行几个步骤组成。接下来还有更细致的一些测试,例如单元测试、集成测试、确认测试、白盒测试和黑河测试。
以下为一个用于传输分析的基于云的决策支持系统(C-DSS)下的一个智能模型及其详细构成。
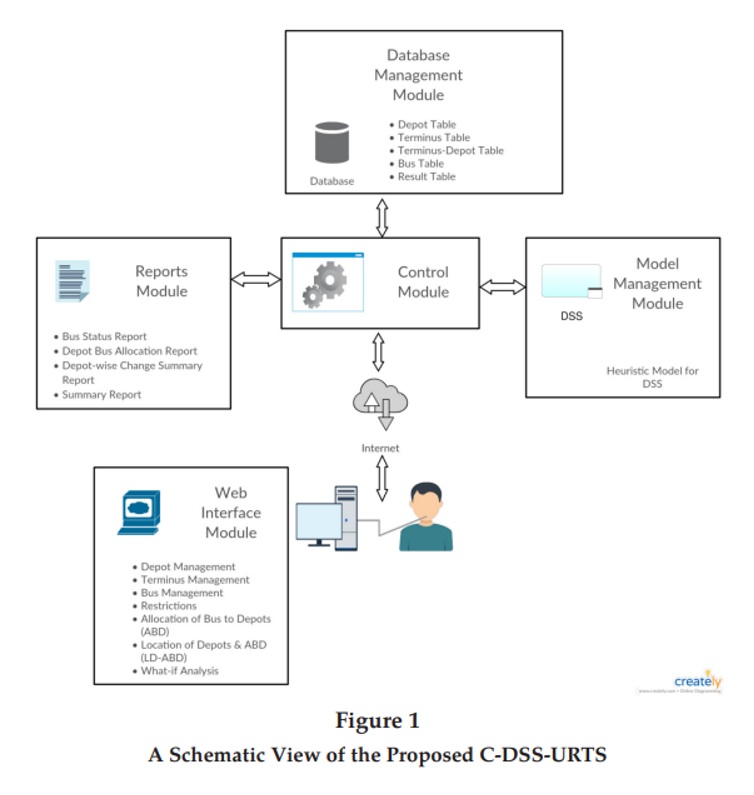
The proposed C-DSS-URTS(urban road transportation systems) consists of 5 interconnected modules, namely Web Interface Module, Database Management Module, Model Management Module, Report Generation Module, Control Module.
The Web Interface Module supports the user to choose any one of option: Depot Management Interface, Terminus Management Interface, Bus Management Interface, Constraint Interface, ABD Interface, LD-ABD Interface, and What-if Analysis Interface.
The Depot-Management option introduced in the WIM provides the required user interface to display the existing depots and its details.
The Terminus-Management option gives a user interface to “Add”, “Delete” and “Edit” the terminus details of URTS.
The Bus-Management interface provides options to “Add”, “Edit”, and “Delete” data related to buses.
Constraint interface provides user to specify any special constraints on the allocation of a bus to the available depots.
The ABD interface provides the summary of data and an option to execute the solution methodology, provided in the Model Management Module (MMM) of C-DSS-URTS, for obtaining efficient solution/decision for ABD problem of URTS.
The LD-ABD interface provides the existing data on ABD and LD-ABD data along with option to add other information.
In the last interface, the user can perform “What-if” Analysis for various scenarios by carrying out the operations: Modifying depot (specifying what-if capacity changes) capacity, Adding terminus, Adding buses, and Changing the existing terminus for a bus.
The Database Management Module (DMM) maintains all databases required for solving the decision problems: ABD or LD-ABD in optimizing the cost of operation of City Buses through C-DSS-URTS. The databases required for the C-DSS-URTS are Depot_Table, Terminus_Table, Terminus_Depot_Table, Bus_Table, and Result_Table.
The Depot_Table captures, for each depot, 12 attributes’ values in 12 columns (including Serial-Number, Depot-Code, Depot-Name, Division, Current-Capacity, Maximum-Capacity, What-if-Capacity, Operating-Cost, Salvage-Cost, Fixed-Cost, Organization-Code and Purpose)related to Serial number, Depot-Code, Depot-Name, Division, Current-Capacity, Maximum-Capacity, What-if Capacity, Operating-Cost, Salvage-Cost, Fixed-Cost, Organization-code, and Purpose respectively.
The Terminus_Table stores 5 values of the parameters: Terminus-Id, Terminus-Code, Terminus-Name, Organization-Code, and Purpose in 5 columns.
The Terminus_Depot_Table stores 6 values of the parameters related to Record-Id, Terminus-Code, Depot-Code, Distance, Organization-Code, and Purpose in 6 columns. The main objective of creating this table is to store the distance between each terminus to each of the depots.
The Bus_Table stores values of 8 parameters: Record-Id, Bus-Number (Route-Number), Depot-Code, Starting-Terminus, Ending-Terminus, Fuel-Cost-per-km, Organization-Code, and Purpose and these are required for every bus.
The Result_Table stores the values of 5 parameters: Record-id, Depot-Code, Bus-Number, Organization-Code, and Purpose related to the optimal/efficient solution for the problem ABD or LD-ABD. Once the C-DSS-URTS generates the results, it is stored in this table.
With this backdrop, for the proposed C-DSS-URTS, the Model Management Module base has a simple efficient heuristic algorithm to address ABD problem as well as LD-ABD problem and appropriate interface to carry out what-if analysis. The heuristic algorithm incorporated in the model base of the MMM is an extension to the heuristic algorithm proposed in Mathirajan et al. The heuristic algorithm proposed in Mathrajan et al. to address the LD-ABD problem follows a two-phase approach.
The two-phase approach followed in the heuristic algorithm proposed in Mathirajan et al. for solving LD-ABD problem, all the three cost: total fixed cost associated with opening new depots, total salvage values associated with closing existing depots, and total dead-kilometer cost associated with ABD problem, are not considered simultaneously while optimizing the cost of operations.
As per the functioning part of the MMM, the MMM invokes the required input for ABD problem or LD-ABD problem suitably depending on the decision maker’s choice on optimally solving ABD problem or LD-ABD problem respectively. Particularly the heuristic algorithm incorporated in the model base requires the following basic input data to obtain optimal/efficient solution for either ABD or LD-ABD problem of URTS: List of depots, List of terminuses and the distance between each terminus to each depot, List of buses and its existing allocation to the depots, Dead kilometer cost for each bus.
Particularly, these input data are invoked in C-DSS-URTS for obtaining optimal/efficient solution for the following scenarios: Allocation of Bus to Depots, Location of Depots and Allocation of Buses to Depots, What if Analysis.
The C-DSS-URTS generates the optimal/efficient solution and the same is stored into Result_Table. The report generation module (RGM) generates the reports based on the data stored in the DMM and the solution stored in Result_Table for the decision problem: ABD or LD-ABD. The generated reports can be presented in screen and can be stored in MS-Excel also. That is, the report generation module retrieves the data from the database tables as well as result table and produces the following reports:Bus_Status_Report,Bus_Depot_Allocation_Report,Depot_wise_Change_Summary_Report, Summary_Report.
In the Bus_Status_Report, for each bus, the details about the Starting-Terminus, Ending-Terminus, existing allocation in terms of the depot, the distance and the cost due to the existing system (and these are extracted from appropriate database tables); and the optimal/efficient solution in terms of the choice of depot for allocation of bus, the distance and the cost due to the allocation of a bus to a depot due to C-DSS-URTS ( and these are extracted from result table) are generated and reported as the report.
Next report displays Bus-Number (or Route-Number), depot allocated by C-DSS-URTS, terminus details, fuel cost per km, dead kilometer cost, etc.
Depot_wise_Change_Summary_Report provides the change summary for each depot by providing details on ‘list of buses moved from existing depot to the depot decided by C-DSS-URTS’ and ‘the list of buses allocated to depot by C-DSS-URTS from other depots’.
Summary_Report provides a summary at the depot level. For each depot, how many buses are allocated and its total dead kilometer as well as total dead kilometer cost. These details are presented corresponding to both existing allocation and the optimal/efficient allocation obtained from C-DSS-URTS. Finally, the cost savings also computed and presented.
The control module (CM) receives the request from the web interface and redirects the control to the respective modules of C-DSS-URTS. The control interface in general follows the below steps for every request:
Step 1: Gets the request from the user interface.
Step 2: Checks the type of request.
Step 3: If the request is to add information related to depots, buses or terminus, it will invoke the respective operation in the Database Management Module (DMM).
Step 4: If the request is viewing the information, it requests the DMM to retrieve the data from the database. Then the control redirects to the user interface module with the required data/information and the user can view the data/information.
Step 5: If the request is to delete the information, it requests the DMM to delete the respective record in the database. An appropriate message is also displayed in the UI through web user interface module.
Step 6: If user requests to execute the algorithm, the control redirects to the Model Management Module (MMM) which executes the algorithm for solving the respective ABD or LD-ABD problem.
Step 7: If the report options are selected in the user interface, the Control Module (CM) generates the reports using the Reports Module (RM) and allows the user to download it in excel format.[2]
[1] Mayank Mohan Sharma, Akshat Agrawal, Harshal Deore, Sandeep Kumar & Rajani Kumari (2020) Revisiting agile software development process based on latest software industry trends, Journal of Information and Optimization Sciences, 41:2, 533-541.
[2] M. Mathirajan, Rajesh Devadas & Ramakrishnan Ramanathan (2020): Transport analytics in action: A cloud-based decision support system for efficient city bus transportation, Journal of Information and Optimization Sciences.

 浙公网安备 33010602011771号