
pandas_profiling
1.describe()和info()函数
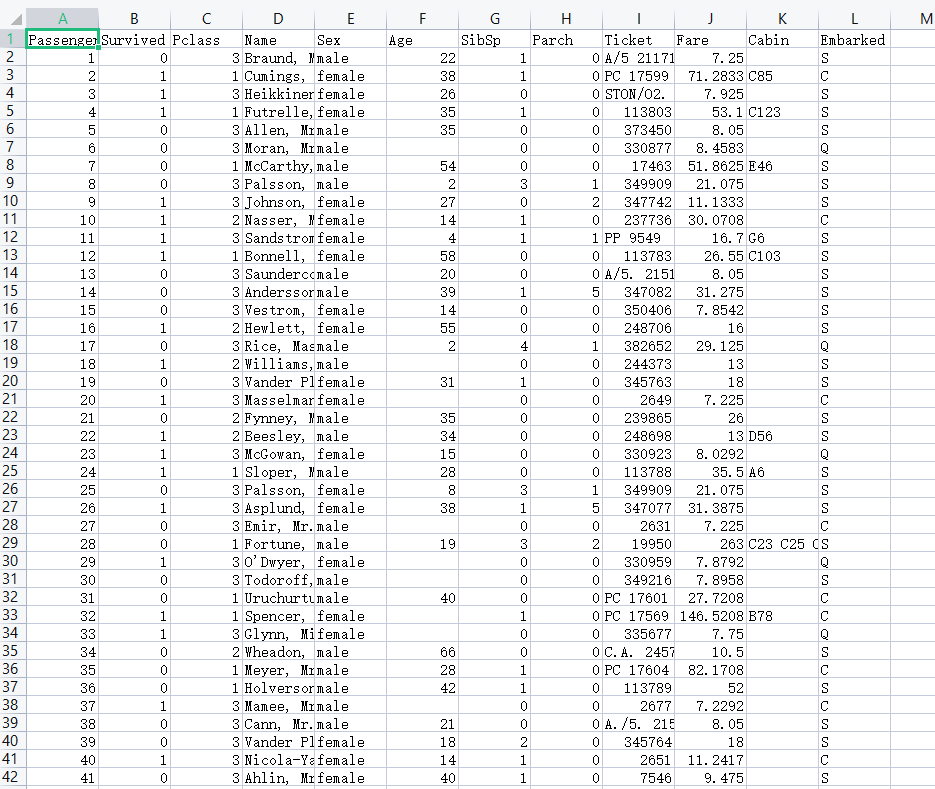
pandas里面有两个重要的函数describe()和info()函数,能够查看数据的一个整体情况,这里我们用经典的泰坦尼克数据集进行演示。
import pandas as pd
# 文件路径
path = r'titanic_data.csv'
# 如果你读取的文件是excel而不是csv的话,那么下面改成pd.read_excel
# header=0代表首行是标题列,sep=','代表csv文件里面的分隔符是逗号
titanic_df = pd.read_csv(path, header=0, sep=',')
# 查看数据的整体情况
print(titanic_df.info())
print('*' * 10)
# 查看数值型的均值,标准差等
print(titanic_df.describe())
print('*' * 10)
# 查看不同列维度之间的相关性
print(titanic_df.corr())
<class 'pandas.core.frame.DataFrame'>
RangeIndex: 891 entries, 0 to 890
Data columns (total 12 columns):
 #   Column       Non-Null Count  Dtype
---  ------       --------------  -----
 0   PassengerId  891 non-null    int64
 1   Survived     891 non-null    int64
 2   Pclass       891 non-null    int64
 3   Name         891 non-null    object
 4   Sex          891 non-null    object
 5   Age          714 non-null    float64
 6   SibSp        891 non-null    int64
 7   Parch        891 non-null    int64
 8   Ticket       891 non-null    object
 9   Fare         891 non-null    float64
 10  Cabin        204 non-null    object
 11  Embarked     889 non-null    object
dtypes: float64(2), int64(5), object(5)
memory usage: 83.7+ KB
None
ps:891 entries代表891行,total 12 columns代表12列,Column代表列名,Dtype是数据类型
**********
       PassengerId    Survived      Pclass  ...       SibSp       Parch        Fare
count   891.000000  891.000000  891.000000  ...  891.000000  891.000000  891.000000
mean   446.000000    0.383838    2.308642  ...    0.523008    0.381594   32.204208
std      257.353842    0.486592    0.836071  ...    1.102743    0.806057   49.693429
min       1.000000    0.000000    1.000000  ...    0.000000    0.000000    0.000000
25%     223.500000    0.000000    2.000000  ...    0.000000    0.000000    7.910400
50%     446.000000    0.000000    3.000000  ...    0.000000    0.000000   14.454200
75%     668.500000    1.000000    3.000000  ...    1.000000    0.000000   31.000000
max     891.000000    1.000000    3.000000  ...    8.000000    6.000000  512.329200

ps:count 统计非空值的个数,mean 计算整型或者浮点型的均值,std 标准差,min,max最小值,最大值,25%表示25%的分位数,75%的分位数

[8 rows x 7 columns]
**********
             PassengerId  Survived    Pclass  ...     SibSp     Parch      Fare
PassengerId     1.000000 -0.005007 -0.035144  ... -0.057527 -0.001652  0.012658
Survived       -0.005007  1.000000 -0.338481  ... -0.035322  0.081629  0.257307
Pclass         -0.035144 -0.338481  1.000000  ...  0.083081  0.018443 -0.549500
Age             0.036847 -0.077221 -0.369226  ... -0.308247 -0.189119  0.096067
SibSp          -0.057527 -0.035322  0.083081  ...  1.000000  0.414838  0.159651
Parch          -0.001652  0.081629  0.018443  ...  0.414838  1.000000  0.216225
Fare            0.012658  0.257307 -0.549500  ...  0.159651  0.216225  1.000000

[7 rows x 7 columns]
2.python忽略warning错误
import warnings
warnings.filterwarnings('ignore')
3.pandas_profiling简介
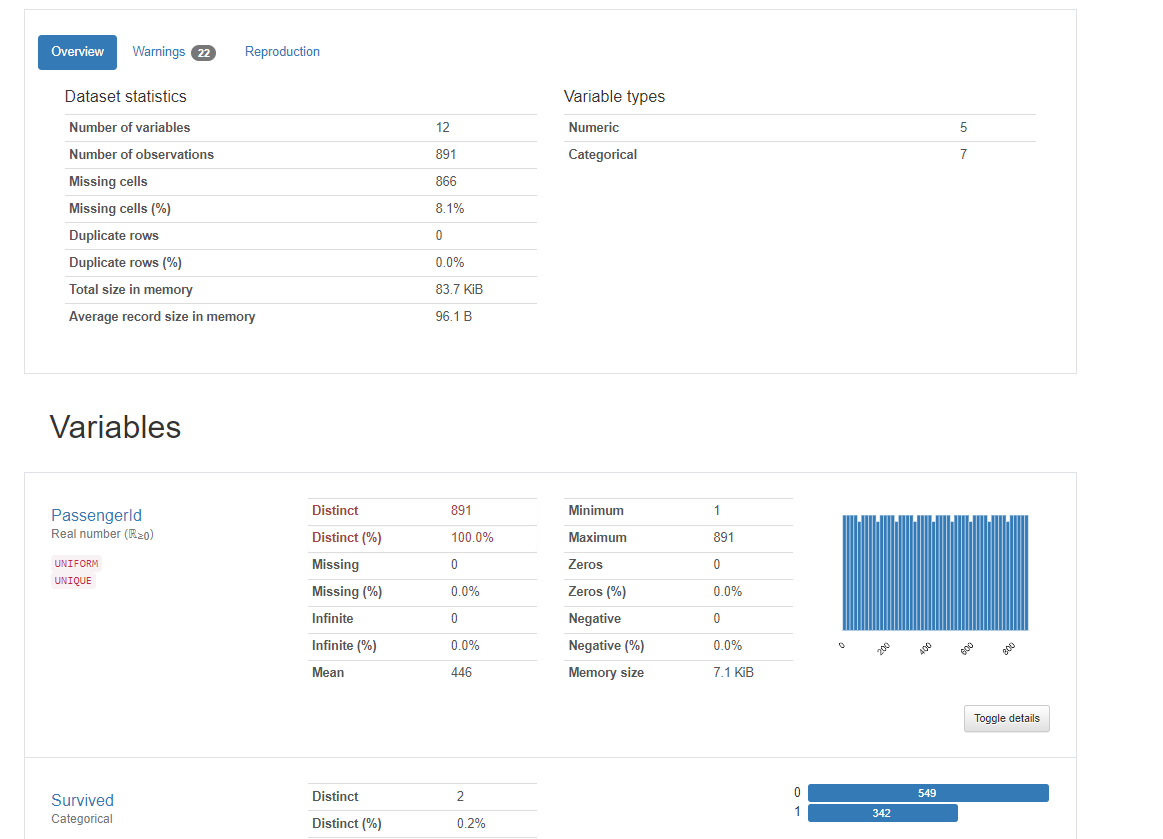
pandas_profiling是第三方库,是基于pandas的DataFrame数据类型,可以简单快速地进行探索性数据分析,这个库只需要三行代码就可以生成数据EDA报告。
对于数据集的每一列,pandas_profiling会提供以下统计信息:
1)、概要:数据类型,唯一值,缺失值,内存大小
2)、分位数统计:最小值、最大值、中位数、Q1、Q3、最大值,值域,四分位
3)、描述性统计:均值、众数、标准差、绝对中位差、变异系数、峰值、偏度系数
4)、最频繁出现的值,直方图/柱状图
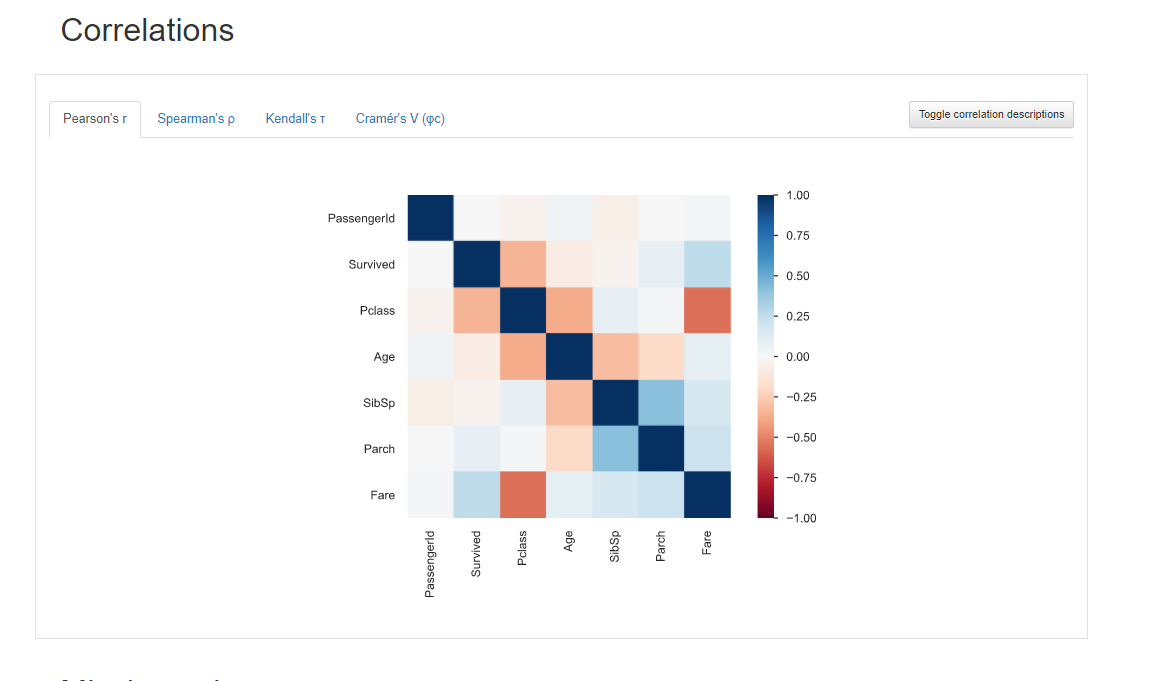
5)、相关性分析可视化:突出强相关的变量,Spearman, Pearson矩阵相关性色阶图
并且这个报告可以导出为HTML,非常方便查看。
pip install pandas-profiling
# 这代码是在pycharm运行的,
# -*- coding: utf-8 -*-
import pandas as pd
import pandas_profiling
import warnings
warnings.filterwarnings('ignore')

titanic_df = pd.read_csv(r'titanic_data.csv', encoding='gb18030')
profile = pandas_profiling.ProfileReport(titanic_df)
profile.to_file("output_file.html")

 浙公网安备 33010602011771号