Echarts 使用(二):动态交互
Echarts 系列文章:
在写这个文章前先看下 Echarts 的最新动态。
Echarts 发布了最新的 5.1.1 版本(21年4月23日),同时官方网站也同步更新了。
新的官方网站的配色看上去更好看了,示例也方便了不少。
对于使用来说,最大的更新是导入的方式:
import * as echarts from 'echarts'
其他使用基本可以不变(如果是按需引入,要再看)。
原先的标题是:“动态高亮”
觉得不是很合适,这个应该叫“动态交互”(今天看了 echarts 官网对新版本特性说明有感)
一、几个主要 API
在大部分的场景中,我们直接使用的 API 比较少,用的比较多的就是 init、setOption。
在实现高亮前需要先了解几个 Echarts 的 API。
1、init
这个是最基础的,每次使用的时候初始化的函数。
    echarts.init(dom: HTMLElement, theme?: string | object, opts?: {
      renderer?: RendererType;
      devicePixelRatio?: number;
      width?: number;
      height?: number;
      locale?: string | LocaleOption;
    })
第一个是必传的,后面的两个参数看自己情况而定。
2、setOption
这个 API 的功能是重置图标的参数,每次更改数据的时候都需要调用这个 API 重置数据。
参数就是我们一般写的配置对象:options。
3、resize
在窗口变化、或者想手动更改图标的大小时可以调用以自适应。
基本使用是:直接调用
chart.resize()
这样是自动使用当前的变化。也可以传参使用指定的值。
chart.resize(opts?: {
    width?: number|string,
    height?: number|string,
    silent?: boolean,
    animation?: {
        duration?: number
        easing?: string
    }
})
4、dispatchAction
这个就是我们今天要说的主角了。
触发一些图表的行为(凡是页面上的交互行为都是通过这个实现)。
所以“自动”就是通过这个 API 去调用指定效果行为的 API。
chart.dispatchAction({
  type: 'type',
  xxx: xxxx // 根据不同的行为传参
})
对于不同的 Action 参数的话,官网有专门的部分介绍。
5、on
这个是对图标实例绑定一些事件处理函数(这个就是 js 里面的事件监听)。
例如常见的鼠标事件(这个不用多说),图标一些组件事件等。
这一部分官网也要专门的部分介绍。
二、动态高亮实例
下面我们就看一个饼图动态高亮的实例。
效果如下:
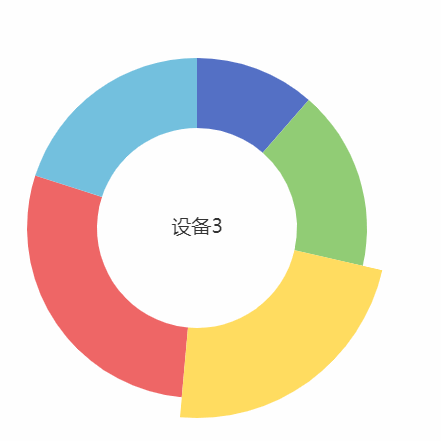
下面是 基于 Vue 组件的代码示例。
<template>
  <div class="dynamic-com">
    <div class="pie-box">
      <ZEcharts ref="pieChart" :options="pieOptions" />
    </div>
  </div>
</template>

<script>
import ZEcharts from '@/components/ZEcharts'

const PIE_OPTIONS = {
  grid: {
    left: 10,
    top: 10,
    right: 10,
    bottom: 10,
    containLabel: true
  },
  series: [
    {
      type: 'pie',
      name: '动态高亮',
      radius: ['50%', '85%'],
      label: { show: false, position: 'center' },
      labelLine: { show: false },
      emphasis: {
        scaleSize: 20,
        label: { show: true, fontSize: 20 }
      },
      data: [
        { value: '20', name: '设备1' },
        { value: '30', name: '设备2' },
        { value: '40', name: '设备3' },
        { value: '50', name: '设备4' },
        { value: '35', name: '设备5' }
      ]
    }
  ]
}

export default {
  components: { ZEcharts },
  data() {
    return {
      pieOptions: PIE_OPTIONS,
      highlightInterval: null,
      pieChart: null,
      pieDataLength: 5,
      higIndex: 0
    }
  },
  mounted() {
    this.pieChart = this.$refs.pieChart.chart
    this.intervalHandler()
    // 绑定 mouseover 事件
    this.pieChart.on('mouseover', (params) => {
      clearInterval(this.highlightInterval)

      // 清除高亮(每次高亮前必须重复该操作,否则会叠加)
      this.pieChart.dispatchAction({
        type: 'downplay',
        seriesIndex: 0
      })

      this.pieChart.dispatchAction({
        type: 'highlight',
        seriesIndex: 0,
        dataIndex: params.dataIndex
      })

      // 鼠标移出后从该处继续高亮
      this.higIndex = params.dataIndex
    })

    // 绑定 mouseout 事件
    this.pieChart.on('mouseout', (params) => {
      this.intervalHandler()
    })
  },
  beforeDestroy() {
    this.highlightInterval && clearInterval(this.highlightInterval)
  },
  methods: {
    intervalHandler() {
      this.pieChart.dispatchAction({
        type: 'downplay',
        seriesIndex: 0
      })

      this.pieChart.dispatchAction({
        type: 'highlight',
        seriesIndex: 0,
        dataIndex: this.higIndex
      })

      this.highlightInterval = setInterval(() => {
        this.pieChart.dispatchAction({
          type: 'downplay',
          seriesIndex: 0
        })

        this.pieDataLength === this.higIndex + 1 ? (this.higIndex = 0) : (this.higIndex++)

        this.pieChart.dispatchAction({
          type: 'highlight',
          seriesIndex: 0,
          dataIndex: this.higIndex
        })
      }, 2000)
    }
  }
}
</script>
为了不能在动态高亮同时,也支持鼠标移入移出高亮,结合事件绑定做了处理。
三、热力图动态过滤
这个是看到有人在群里面提问,就想到了这一点。
在这里也根据这个动态交互测试下。
先看下效果动态图:

这个示例的基本配置选择的是官方给的例子。下面的代码只是添加了一些鼠标监听事件。
<template>
  <div class="dynamic-com">
    <div class="pie-box" style="width:700px;">
      <ZEcharts ref="heatMapChart" :options="heatMapOptions" />
    </div>
  </div>
</template>

<script>
import ZEcharts from '@/components/ZEcharts'

// 下面配置项使用的是官方示例配置
const hours = ['12a', '1a', '2a', '3a', '4a', '5a', '6a',
  '7a', '8a', '9a', '10a', '11a',
  '12p', '1p', '2p', '3p', '4p', '5p',
  '6p', '7p', '8p', '9p', '10p', '11p']
const days = ['Saturday', 'Friday', 'Thursday',
  'Wednesday', 'Tuesday', 'Monday', 'Sunday']

let data = [[0, 0, 5], [0, 1, 1], [0, 2, 0], [0, 3, 0], [0, 4, 0], [0, 5, 0], [0, 6, 0], [0, 7, 0], [0, 8, 0], [0, 9, 0], [0, 10, 0], [0, 11, 2], [0, 12, 4], [0, 13, 1], [0, 14, 1], [0, 15, 3], [0, 16, 4], [0, 17, 6], [0, 18, 4], [0, 19, 4], [0, 20, 3], [0, 21, 3], [0, 22, 2], [0, 23, 5], [1, 0, 7], [1, 1, 0], [1, 2, 0], [1, 3, 0], [1, 4, 0], [1, 5, 0], [1, 6, 0], [1, 7, 0], [1, 8, 0], [1, 9, 0], [1, 10, 5], [1, 11, 2], [1, 12, 2], [1, 13, 6], [1, 14, 9], [1, 15, 11], [1, 16, 6], [1, 17, 7], [1, 18, 8], [1, 19, 12], [1, 20, 5], [1, 21, 5], [1, 22, 7], [1, 23, 2], [2, 0, 1], [2, 1, 1], [2, 2, 0], [2, 3, 0], [2, 4, 0], [2, 5, 0], [2, 6, 0], [2, 7, 0], [2, 8, 0], [2, 9, 0], [2, 10, 3], [2, 11, 2], [2, 12, 1], [2, 13, 9], [2, 14, 8], [2, 15, 10], [2, 16, 6], [2, 17, 5], [2, 18, 5], [2, 19, 5], [2, 20, 7], [2, 21, 4], [2, 22, 2], [2, 23, 4], [3, 0, 7], [3, 1, 3], [3, 2, 0], [3, 3, 0], [3, 4, 0], [3, 5, 0], [3, 6, 0], [3, 7, 0], [3, 8, 1], [3, 9, 0], [3, 10, 5], [3, 11, 4], [3, 12, 7], [3, 13, 14], [3, 14, 13], [3, 15, 12], [3, 16, 9], [3, 17, 5], [3, 18, 5], [3, 19, 10], [3, 20, 6], [3, 21, 4], [3, 22, 4], [3, 23, 1], [4, 0, 1], [4, 1, 3], [4, 2, 0], [4, 3, 0], [4, 4, 0], [4, 5, 1], [4, 6, 0], [4, 7, 0], [4, 8, 0], [4, 9, 2], [4, 10, 4], [4, 11, 4], [4, 12, 2], [4, 13, 4], [4, 14, 4], [4, 15, 14], [4, 16, 12], [4, 17, 1], [4, 18, 8], [4, 19, 5], [4, 20, 3], [4, 21, 7], [4, 22, 3], [4, 23, 0], [5, 0, 2], [5, 1, 1], [5, 2, 0], [5, 3, 3], [5, 4, 0], [5, 5, 0], [5, 6, 0], [5, 7, 0], [5, 8, 2], [5, 9, 0], [5, 10, 4], [5, 11, 1], [5, 12, 5], [5, 13, 10], [5, 14, 5], [5, 15, 7], [5, 16, 11], [5, 17, 6], [5, 18, 0], [5, 19, 5], [5, 20, 3], [5, 21, 4], [5, 22, 2], [5, 23, 0], [6, 0, 1], [6, 1, 0], [6, 2, 0], [6, 3, 0], [6, 4, 0], [6, 5, 0], [6, 6, 0], [6, 7, 0], [6, 8, 0], [6, 9, 0], [6, 10, 1], [6, 11, 0], [6, 12, 2], [6, 13, 1], [6, 14, 3], [6, 15, 4], [6, 16, 0], [6, 17, 0], [6, 18, 0], [6, 19, 0], [6, 20, 1], [6, 21, 2], [6, 22, 2], [6, 23, 6]]

data = data.map(function(item) {
  return [item[1], item[0], item[2] || '-']
})

const HEATMAP_OPTIONS = {
  tooltip: {
    position: 'top'
  },
  grid: {
    height: '50%',
    left: 100,
    top: '10%'
  },
  xAxis: {
    type: 'category',
    data: hours,
    splitArea: {
      show: true
    }
  },
  yAxis: {
    type: 'category',
    data: days,
    splitArea: {
      show: true
    }
  },
  visualMap: {
    min: 0,
    max: 10,
    range: [0, 10],
    calculable: true,
    orient: 'horizontal',
    left: 'center',
    bottom: '15%'
  },
  series: [{
    name: 'Punch Card',
    type: 'heatmap',
    data: data,
    label: {
      show: true
    },
    emphasis: {
      itemStyle: {
        shadowBlur: 10,
        shadowColor: 'rgba(0, 0, 0, 0.5)'
      }
    }
  }]
}

export default {
  components: { ZEcharts },
  data() {
    return {
      pieOptions: PIE_OPTIONS,
      highlightInterval: null,
      pieChart: null,
      pieDataLength: 5,
      higIndex: 0,

      heatMapChart: null,
      heatMapOptions: HEATMAP_OPTIONS
    }
  },
  mounted() {
    // 热力图
    this.heatMapChart = this.$refs.heatMapChart.chart

    this.heatMapChart.on('mouseover', (params) => {
      this.heatMapOptions.visualMap.range = [params.data[2], params.data[2]]
    })

    this.heatMapChart.on('mouseout', (params) => {
      this.heatMapOptions.visualMap.range = [0, 10]
    })

    // 鼠标全局移出事件(移出当前图标)
    // 之所以用这个的原因
    //  1、heatmap 对 mouseout 监听不到,没有效果
    //  2、在移出图表后重置 visualMap range 是合理的
    this.heatMapChart.on('globalout', (params) => {
      this.heatMapOptions.visualMap.range = [0, 10]
    })
  }
}
</script>

 浙公网安备 33010602011771号