


运维数据提取与可视化
项目在实际的运行过程中需要对硬件的情况进行一个实时的统计与监测,但是有的系统会自带有一些可视化页面或功能,或者是针对某一项或某几项指标进行可视化,但是如果需要对数据进行针对性的可视化则需要进行相应的设计。
在本次的案例中,针对某系统中项目的实际情况进行数据的提取与可视化。
例如原始数据如下所示:

第一步:数据提取程序实现
import numpy as np
import matplotlib.pyplot as plt
import seaborn as sns
import pandas as pd
%matplotlib inline
sns.set_style('darkgrid')
f = open('C:/********************.txt')
lines = f.readlines()
# 提取日期
import re
patter_time = re.compile(r'\d{4}\-*\d{2}\-*\d{2}\ \d{2}\:\d{2}')
result_time = []
for line in lines:
    all_time = patter_time.findall(line)
    all_time = all_time[0]
    result_time.append(all_time)
# 提取占用内存
patter_memory_part1 = re.compile(r'\"[a-zA-Z]+":\d*')
result_memory_auxiliary = []
for line in lines:
    all_memory_auxiliary = patter_memory_part1.findall(line)
    all_memory_auxiliary = all_memory_auxiliary[0]
    result_memory_auxiliary.append(all_memory_auxiliary)
patter_memory_part2 = re.compile(r'[0-9]+')
result_memory = []
for memory in result_memory_auxiliary:
    all_memory = patter_memory_part2.findall(memory)
    all_memory = all_memory[0]
    result_memory.append(all_memory)
# 提取使用CPU
patter_cup_part1 = re.compile(r'\"[a-zA-Z]+":\d*\}')
result_cup_auxiliary = []
for line in lines:
    all_cup_auxiliary = patter_cup_part1.findall(line)
    all_cup_auxiliary = all_cup_auxiliary[0]
    result_cup_auxiliary.append(all_cup_auxiliary)
patter_cup_part2 = re.compile(r'[0-9]+')
result_cup = []
for cup in result_cup_auxiliary:
    all_cup = patter_cup_part2.findall(cup)
    all_cup = all_cup[0]
    result_cup.append(all_cup)
# list合并
auxiliary = np.vstack((result_time,result_memory))
all_result = np.vstack((auxiliary,result_cup))
all_result_df = pd.DataFrame(all_result)
all_result_df = all_result_df.T
all_result_df
第二步:数据以csv格式导出
all_result_df.to_csv('C:/**********************.csv', sep=',', header=False, index=False)
第三步:数据可视化,使用双y轴的形式
在这部分中需要对数据的格式进行转化,时间数据需要由string转为dateframe,数据由string转为int。
import datetime
all_time = [datetime.datetime.strptime(time, '%Y-%m-%d %H:%M') for time in all_time]
all_memory = [int(memory) for memory in all_memory]
all_cup = [int(cup) for cup in all_cup]
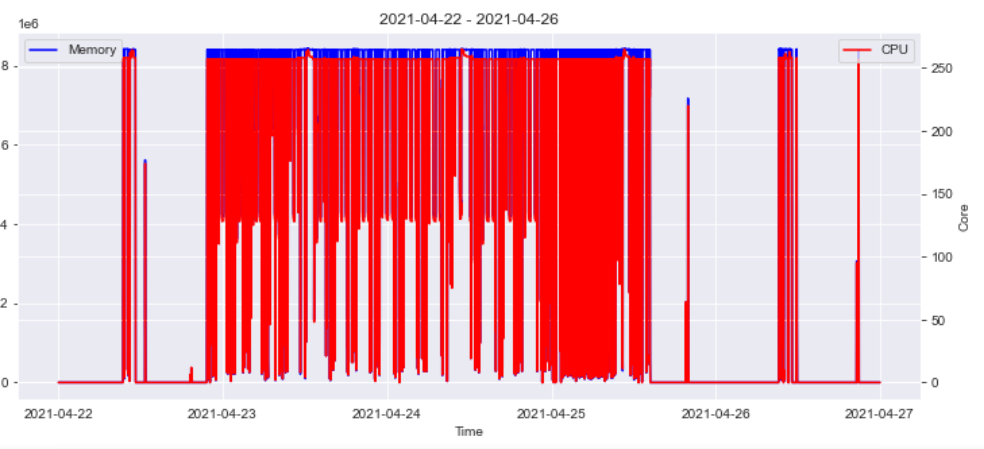
plt.plot(all_time, all_memory, color = 'blue', label = 'Memory')
plt.legend(loc = 'upper left')
plt.plot(all_time, all_memory, color = 'blue', label = 'Memory')
plt.legend(loc = 'upper left')
plt.ylabel('KB')
plt.xlabel('Time')
plt.title('2021-04-22 - 2021-04-26')
plt.twinx()
plt.plot(all_time, all_cup, color = 'red', label = 'CPU')
plt.ylabel('Core')
plt.legend(loc = 'upper right')
plt.show()
结果如下:

 浙公网安备 33010602011771号