

决策树的可视化(sklearn可视化案例)
可视化
数据集
Iris数据集。
导入python库和实验数据集
import pandas as pd
import numpy as np
import matplotlib.pyplot as plt
from sklearn.datasets import load_iris
from sklearn.tree import DecisionTreeClassifier
from sklearn.model_selection import train_test_split
from sklearn import tree
# 加载数据集
data = load_iris()
# 转换成.DataFrame形式
df = pd.DataFrame(data.data, columns = data.feature_names)
# 添加品种列
df['Species'] = data.target

# 用数值替代品种名作为标签
target = np.unique(data.target)
target_names = np.unique(data.target_names)
targets = dict(zip(target, target_names))
df['Species'] = df['Species'].replace(targets)

# 提取数据和标签
X = df.drop(columns="Species")
y = df["Species"]
feature_names = X.columns
labels = y.unique()
# 数据集切分成60%训练集,40%测试
X_train, test_x, y_train, test_lab = train_test_split(X,y,
                                                 test_size = 0.4,
                                                 random_state = 42)
model = DecisionTreeClassifier(max_depth =3, random_state = 42)
model.fit(X_train, y_train)
四种可视化决策树的方式
1.文字表示
# 以文字形式输出树
text_representation = tree.export_text(model)
print(text_representation)
|--- feature_2 <= 2.45
| |--- class: setosa
|--- feature_2 > 2.45
| |--- feature_3 <= 1.75
| | |--- feature_2 <= 5.35
| | | |--- class: versicolor
| | |--- feature_2 > 5.35
| | | |--- class: virginica
| |--- feature_3 > 1.75
| | |--- feature_2 <= 4.85
| | | |--- class: virginica
| | |--- feature_2 > 4.85
| | | |--- class: virginica
2. 使用plot_tree函数画图表示
# 用图片画出
plt.figure(figsize=(15,10)) #
a = tree.plot_tree(model,
                   feature_names = feature_names,
                   class_names = labels,
                   rounded = True,
                   filled = True,
                   fontsize=16)
plt.show()
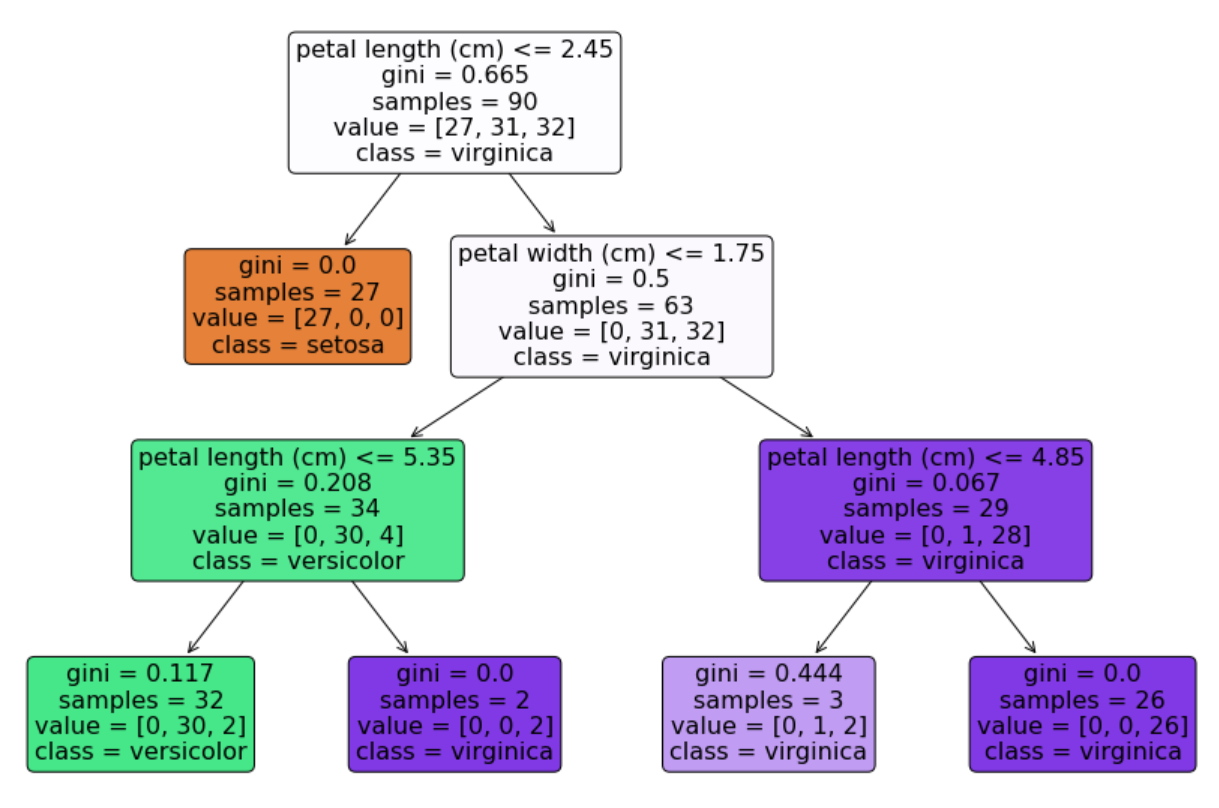
实际上,存储在scikit-learn的tree模块中的有GraphViz,所以直接调用plot_tree能够输出与使用GraphViz的方法相同的图形。
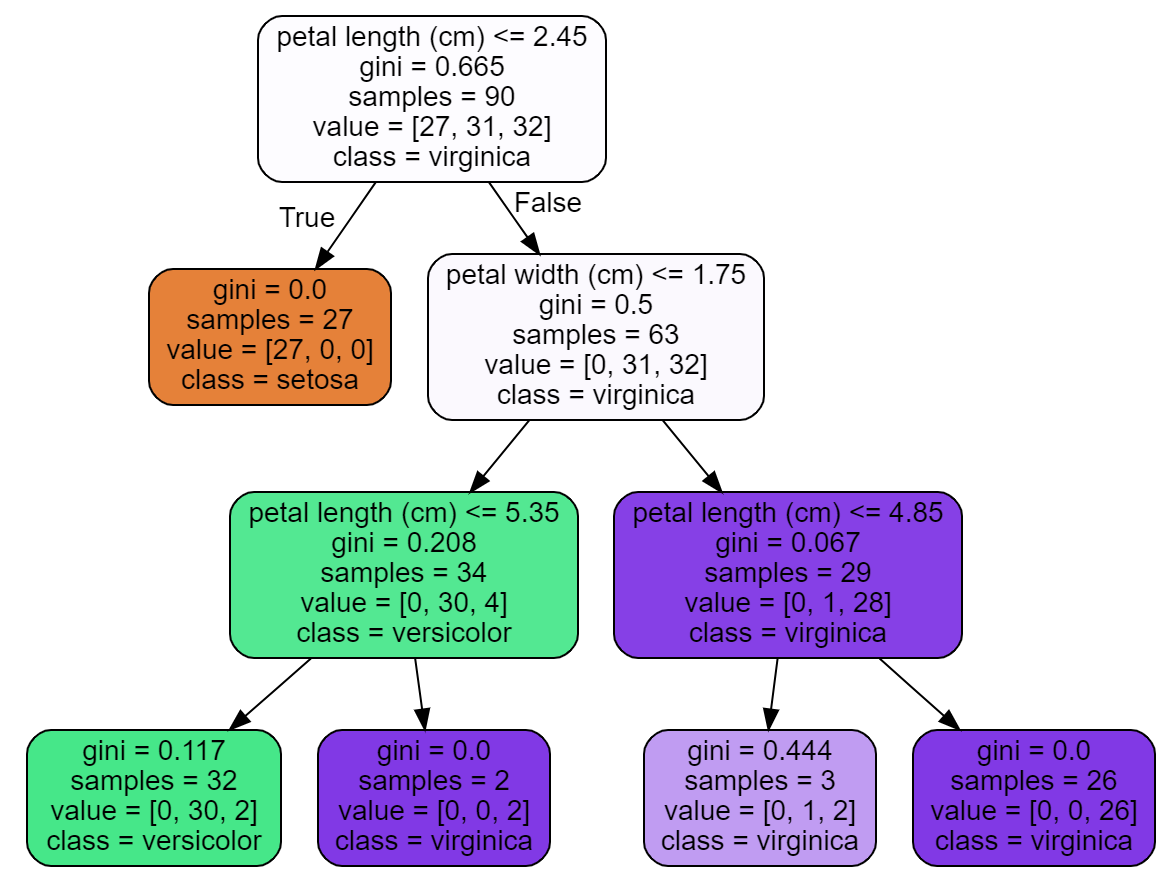
3.graphviz画图
sklearn.tree.export_graphviz以DOT格式导出决策树模型
# DOT data
dot_data = tree.export_graphviz(model, out_file=None,
                                feature_names=data.feature_names,
                                class_names=data.target_names,
                                filled=True,
                                rounded=True)

# Draw graph
import graphviz
graph = graphviz.Source(dot_data, format="png")
graph
4. plot_decision_region函数可视化
遇到的问题及解决
Graphviz模块按照、 环境变量的问题
安装步骤:
-
去官网安装graphviz
-
配置环境变量:安装路径\bin\dot.exe
-
安装到python:pip install Graphviz
-
重启(建议)
参考
【1】解决failed to execute [‘dot’, ‘-Tsvg’], make sure the Graphviz executables are on your systems的问题
【2】sklearn.tree.plot_tree官方文档
【3】sklearn几种分类算法可视化


 浙公网安备 33010602011771号