

绝佳教程:http://pyecharts.org/#/zh-cn/prepare?id=%E4%BD%BF%E7%94%A8%E4%B8%BB%E9%A2%98
安装 pyecharts
  pip install pyecharts
#!/usr/bin/env python
# -*- coding: utf-8 -*-
# @Time : 2018/10/28 20:45
# @Author : ystraw
# @Site :
# @File : huaTu.py
# @Software: PyCharm Community Edition
# @function:
from pyecharts import Bar, Line, Overlap
from pyecharts import Pie
#条形图:
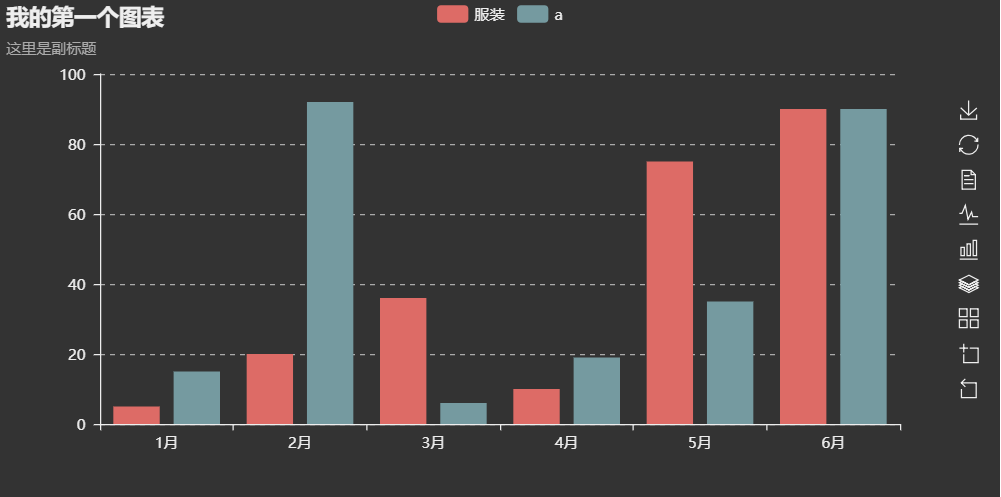
def myBar():
bar = Bar("我的第一个图表", "这里是副标题")
bar.use_theme('dark')
attr = [ '{}月'.format(i) for i in range(1,7)]
bar.add("服装",
attr, [5, 20, 36, 10, 75, 90],
is_more_utils=True) #可以按右边的下载按钮将图片下载到本地,如果想要提供更多实用工具按钮,请在 add() 中设置 is_more_utils 为 True
bar.add("a", attr,
[15, 92, 6, 19, 35, 90],
is_more_utils=True)
bar.render() # 生成本地HTML文件,可以加路径render(r"e:\my_first_chart.html")
#饼图:
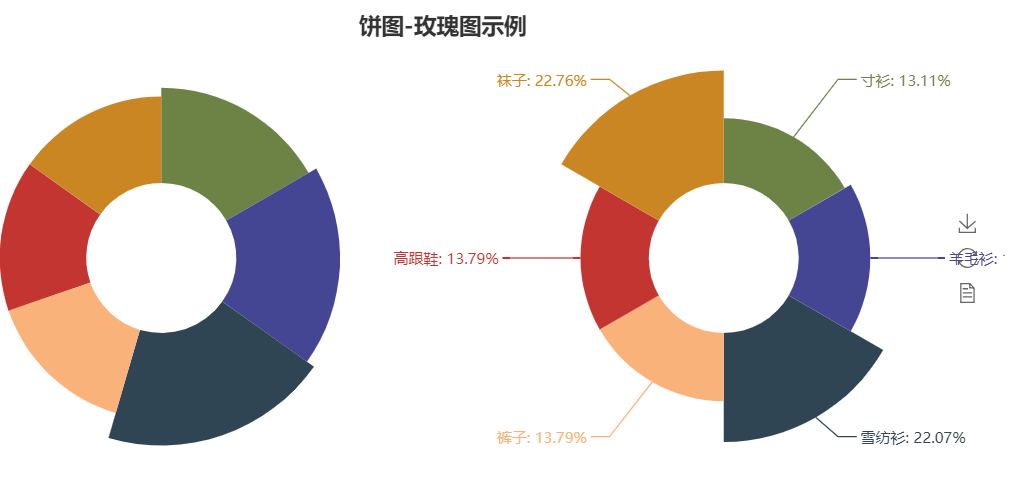
def myPie():
attr = ['寸衫', '羊毛衫', '雪纺衫', '裤子', '高跟鞋', '袜子']
v1 = [11, 12, 13, 10, 10,10]
v2 = [19, 21, 32, 20, 20,33]
pie = Pie('饼图-玫瑰图示例', title_pos='center', width=900)
pie.add('商品A', attr, v1, center=[25,50], is_random=True, radius=[30,75],rosetype='radius')
pie.add('商品B', attr, v2, center=[75,50], is_random=True, radius=[30,75],rosetype='area',
is_legend_show=False, is_label_show=True)
pie.render()
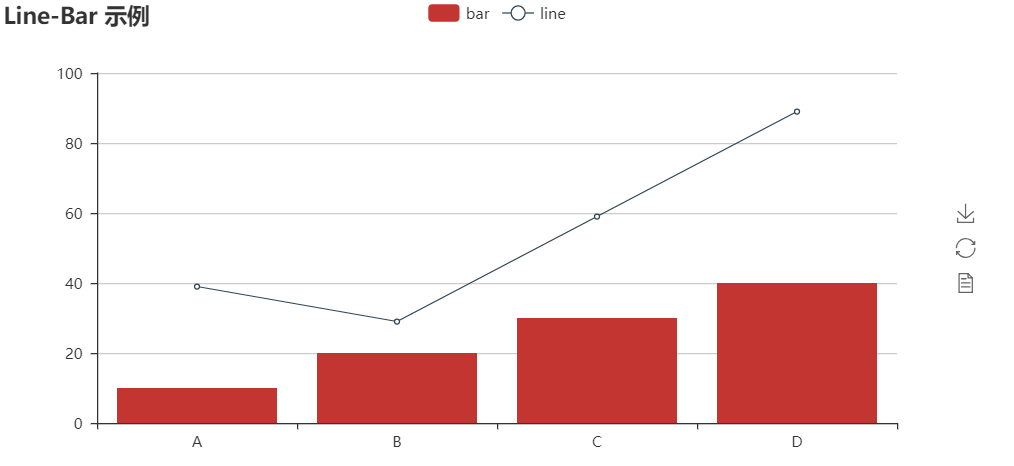
def two_pic():
attr = ['A', 'B', 'C', 'D']
v1 = [10, 20, 30, 40]
v2 = [39, 29, 59, 89]
bar = Bar('Line-Bar 示例')
bar.add('bar',attr,v1)
line = Line()
line.add('line', attr, v2)
overlap = Overlap()
overlap.add(bar)
overlap.add(line)
overlap.render()
if __name__ == '__main__':
two_pic()
生成的是hmtl, 打开可以看到图片,可以通过图片右侧的下载工具下载:
=========================
=============================

 浙公网安备 33010602011771号