Java 性能分析工具-JProfiler
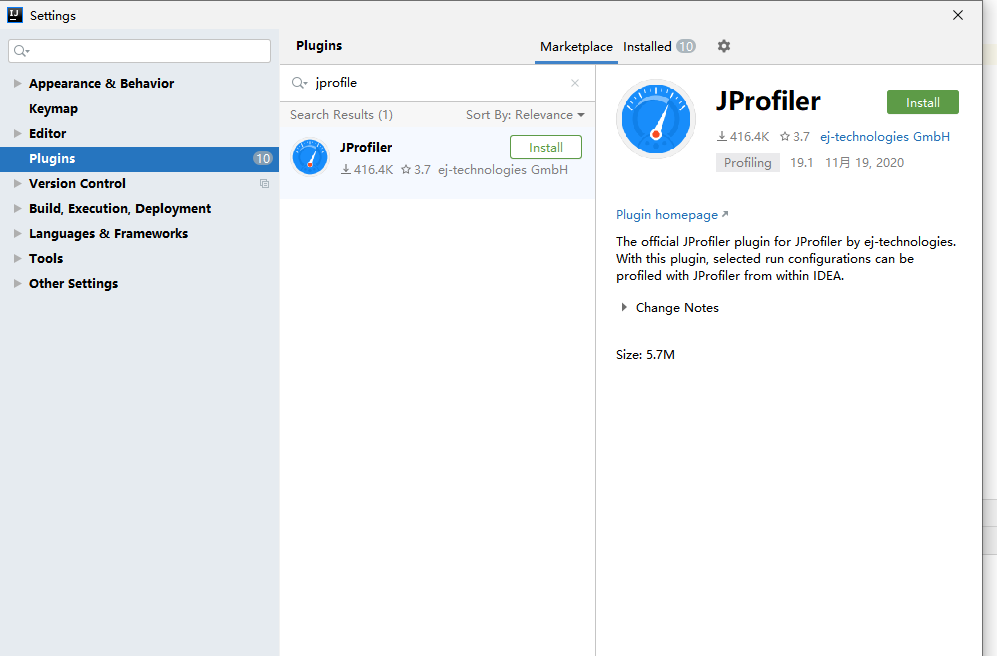
安装
直接安装或者在idea插件安装
GC Roots溯源
- 代码
/**
 * @describe: GCRootsTest
 * @author: zhuCw
 * @date: 2020/11/24 18:30
 */
public class GCRootsTest {
    public static void main(String[] args) {
        List<Object> numList = new ArrayList<>();
        Date birth = new Date();

        for (int i = 0; i < 100; i++) {
            numList.add(String.valueOf(i));
            try {
                Thread.sleep(10);
            } catch (InterruptedException e) {
                e.printStackTrace();
            }
        }

        System.out.println("数据添加完毕,请操作:");
        new Scanner(System.in).next();
        numList = null;
        birth = null;

        System.out.println("numList、birth已置空,请操作:");
        new Scanner(System.in).next();

        System.out.println("结束");
    }
}
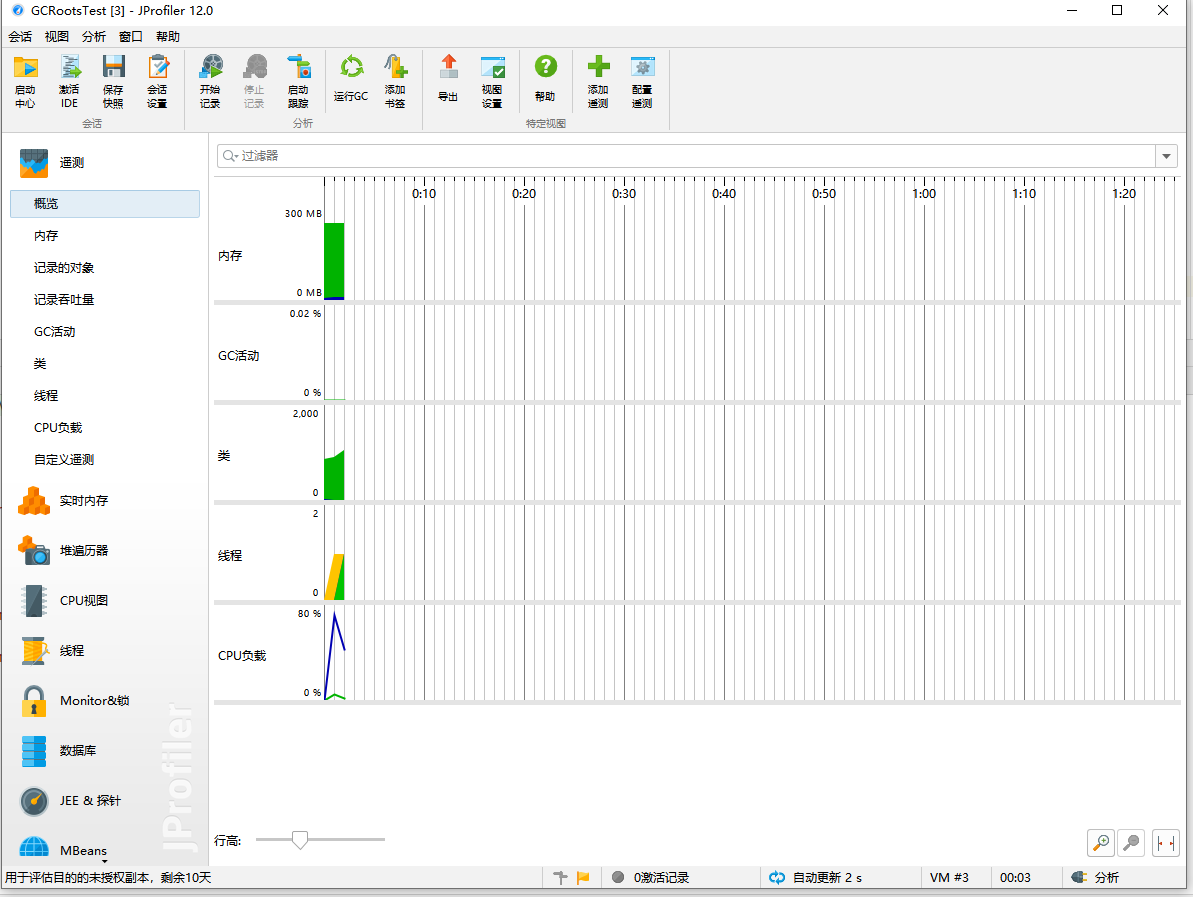
- 使用idea 的jprofile运行该代码
![]()
- 实时内存-> 所有对象可以查看所有内存的实时情况
![]()
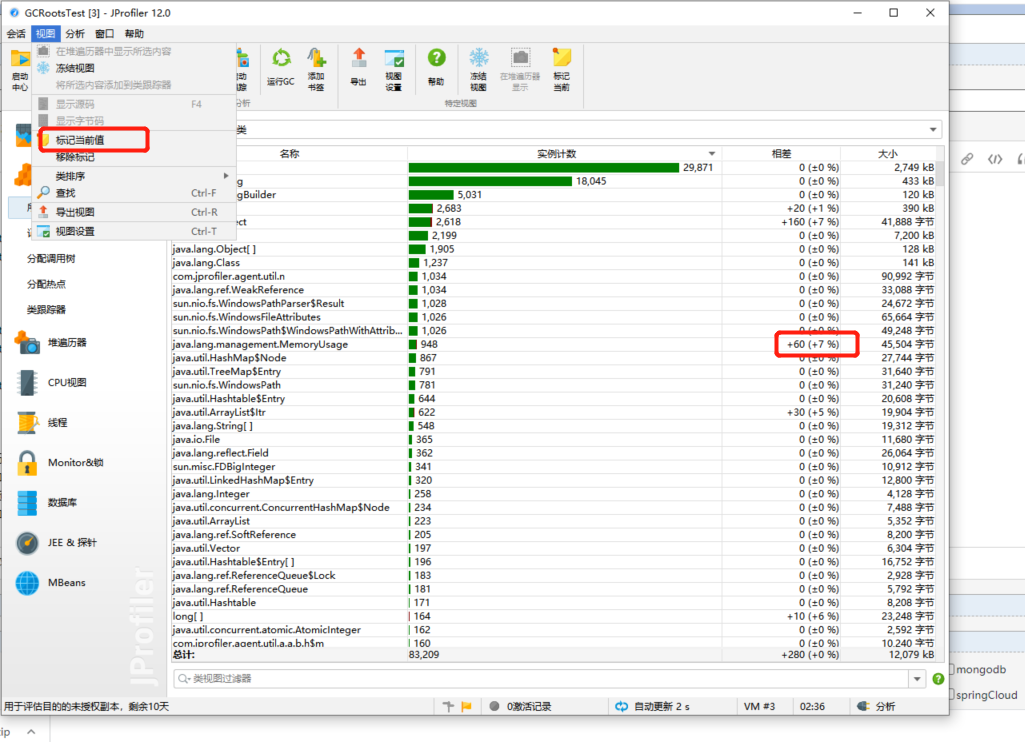
- 视图->标记当前值 可以查看动态变化
![]()
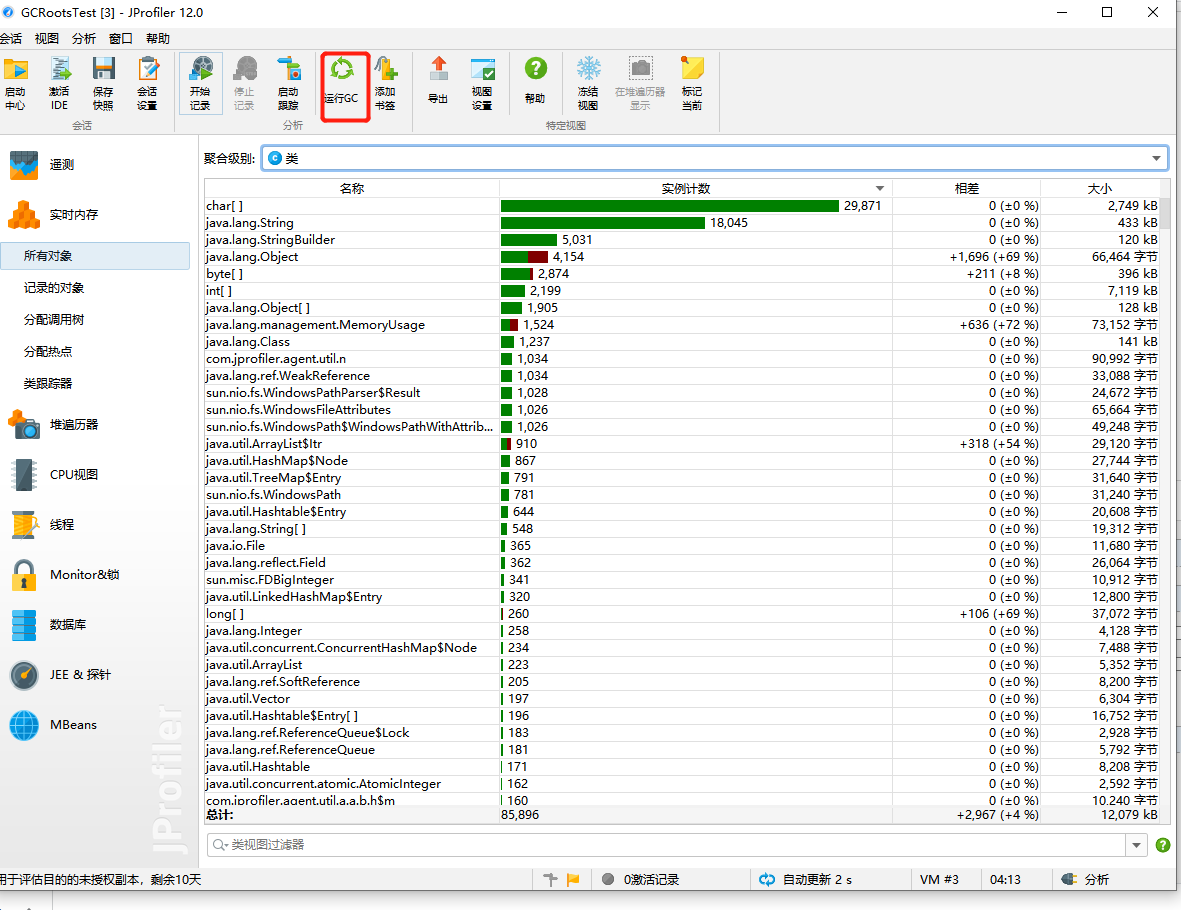
- 运行GC 可以直接执行GC操作
![]()
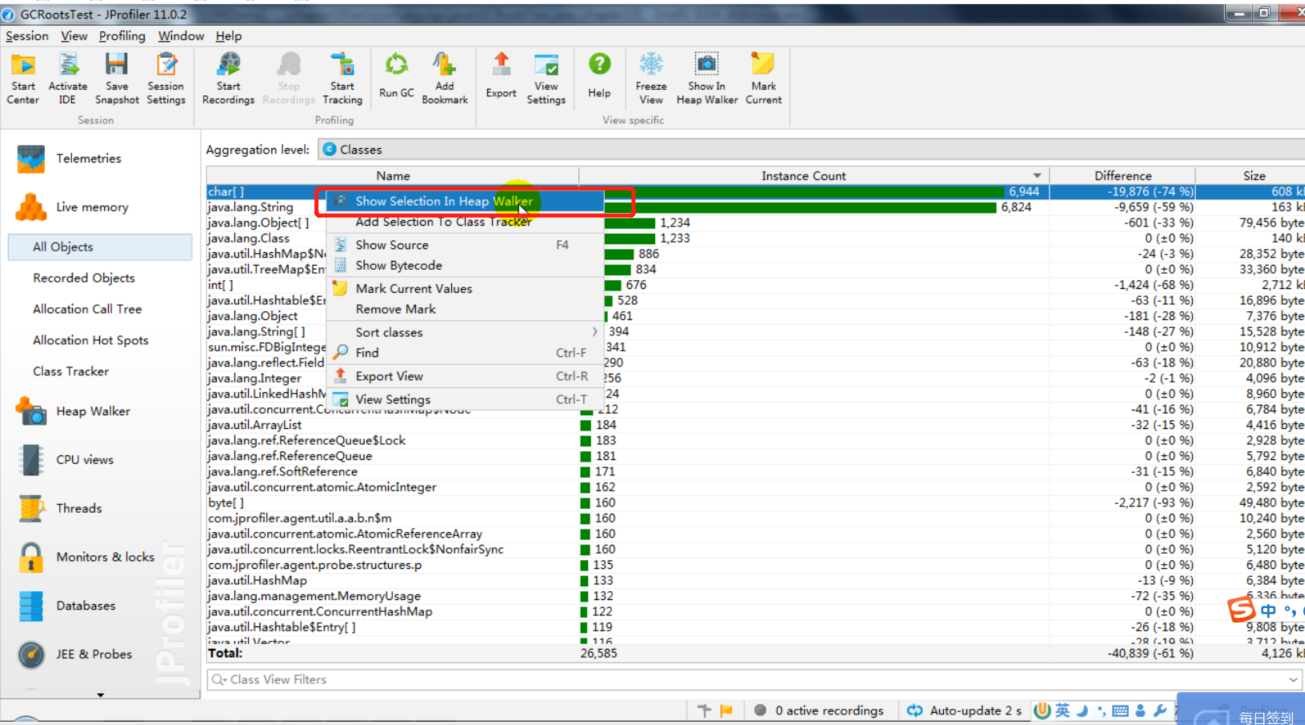
- 选中要分析的对象,右键 show selection in heap walker
![]()
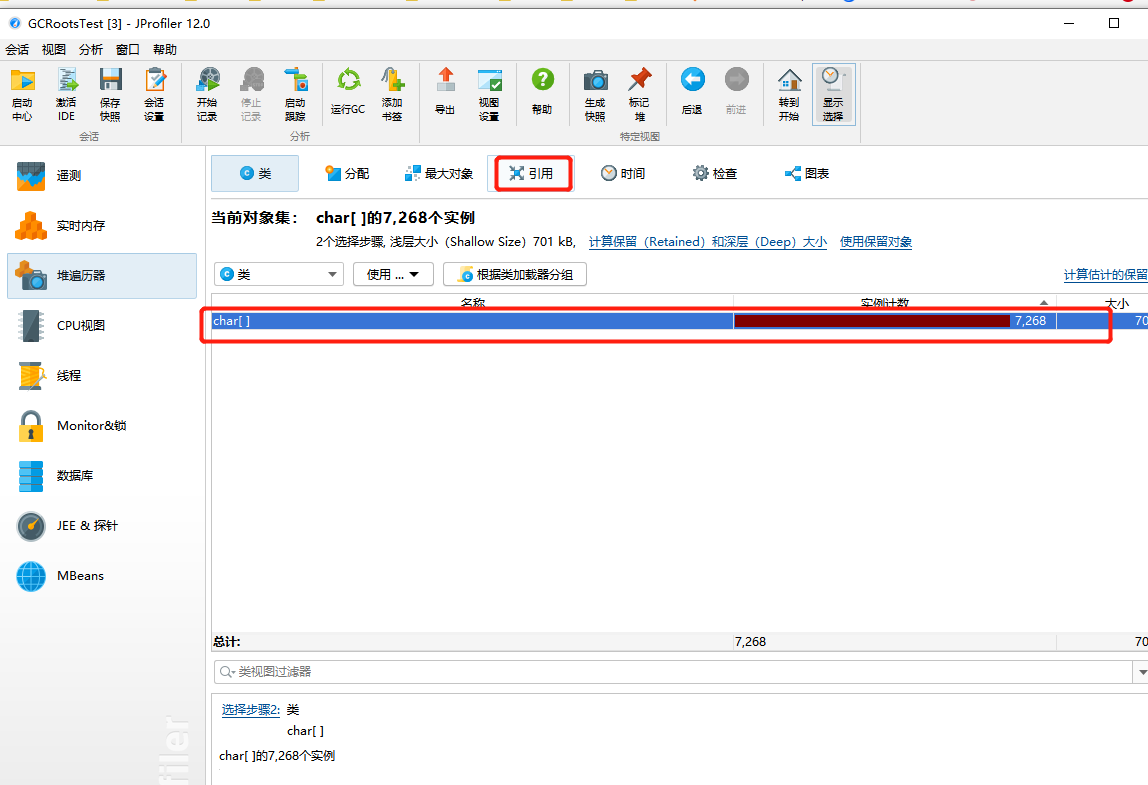
- 点击引用
![]()
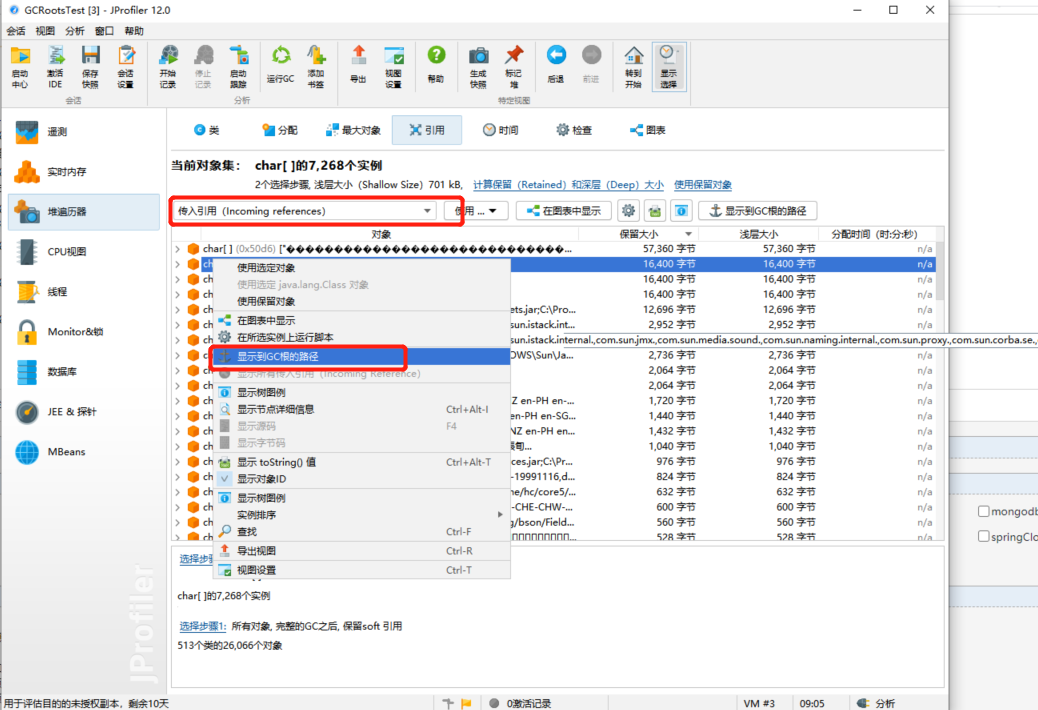
- 传入引用 选中对象 右键 -> 显示到GC的路径进行GC溯源
![]()

帮助文档
https://www.ej-technologies.com/resources/jprofiler/help/doc/main/introduction.html

 浙公网安备 33010602011771号