

一、prometheus基础监控
一、系统环境
root@prometheus:~# cat /etc/issue
Ubuntu 20.04.3 LTS \n \l

192.168.88.200 prometheus-server
192.168.88.201 node1
192.168.88.202 node2

192.168.88.101 k8s-master
192.168.88.102 k8s-node1
192.168.88.103 k8s-node2
二、二进制安装prometheus
prometheus官网下载地址:https://prometheus.io/download/
# 解压二进制包
root@prometheus:~# tar xf /usr/local/src/prometheus-2.30.3.linux-amd64.tar.gz -C /usr/local/
root@prometheus:~# cd /usr/local/
root@prometheus:/usr/local# ln -sv prometheus-2.30.3.linux-amd64/ prometheus
'prometheus' -> 'prometheus-2.30.3.linux-amd64/'
root@prometheus:/usr/local# cd prometheus
root@prometheus:/usr/local/prometheus# ls
LICENSE  NOTICE  console_libraries  consoles  prometheus  prometheus.yml  promtool
root@prometheus:/usr/local/prometheus#


# prometheus.service 文件
root@prometheus:~# cat > /etc/systemd/system/prometheus.service << EOF
> [Unit]
> Description=Prometheus Server
> Documentation=https://prometheus.io/docs/introduction/overview
> After=network.target
>
> [Service]
> Restart=on-failure
> WorkingDirectory=/usr/local/prometheus
> ExecStart=/usr/local/prometheus/prometheus --config.file=/usr/local/prometheus/prometheus.yml
>
> [Install]
> WantedBy=multi-user.target
> EOF
root@prometheus:~#


# 启动
root@prometheus:/usr/local# systemctl daemon-reload
root@prometheus:/usr/local# systemctl start prometheus
root@prometheus:/usr/local# netstat -tnpl | grep 9090
tcp6       0      0 :::9090                 :::*                    LISTEN      2787/prometheus
root@prometheus:/usr/local#


# prometheus配置文件
root@prometheus:~# cat /usr/local/prometheus/prometheus.yml
global:
  scrape_interval: 15s # 全局配置,15s收集一次数据
  evaluation_interval: 15s # 全局配置,15s评估一次告警规则是否触发

# 告警组件Alertmanager的配置
alerting:
  alertmanagers:
    - static_configs:
        - targets:
          # - alertmanager:9093

# 告警规则文件,根据evaluation_interval评估间隔”定期评估
rule_files:
  # - "first_rules.yml"
  # - "second_rules.yml"

# 配置指标数据采集
scrape_configs:
  - job_name: "prometheus"

    # metrics_path defaults to '/metrics'
    # scheme defaults to 'http'.

    # 目标主机地址和端口
    static_configs:
      - targets: ["localhost:9090"]
访问prometheus的9090端口,可通过prometheus:9090/metrics来获取prometheus服务器自己的指标数据


三、prometheus采集node指标数据
在node1和node2节点上部署node_exporter
# 在node1和node2上执行以下步骤

# 二进制解包
root@node1:~# cd /usr/local/src/
root@node1:/usr/local/src# tar xf node_exporter-1.2.2.linux-amd64.tar.gz
root@node1:/usr/local/src# cd node_exporter-1.2.2.linux-amd64/
root@node1:/usr/local/src/node_exporter-1.2.2.linux-amd64# ls
LICENSE  NOTICE  node_exporter
root@node1:/usr/local/src/node_exporter-1.2.2.linux-amd64# mv node_exporter /usr/local/bin/
root@node1:/usr/local/src/node_exporter-1.2.2.linux-amd64#


# 创建service文件
root@node1:~# cat > /etc/systemd/system/node-exporter.service << EOF
> [Unit]
> Description=Prometheus Node Exporter
> After=network.target
>
> [Service]
> ExecStart=/usr/local/bin/node_exporter
>
> [Install]
> WantedBy=multi-user.target
> EOF
root@node1:~#


# 启动
root@node1:~# systemctl daemon-reload
root@node1:~# systemctl start node-exporter
root@node1:~# netstat -tnlp | grep 9100
tcp6       0      0 :::9100                 :::*                    LISTEN      2648/node_exporter
root@node1:~#
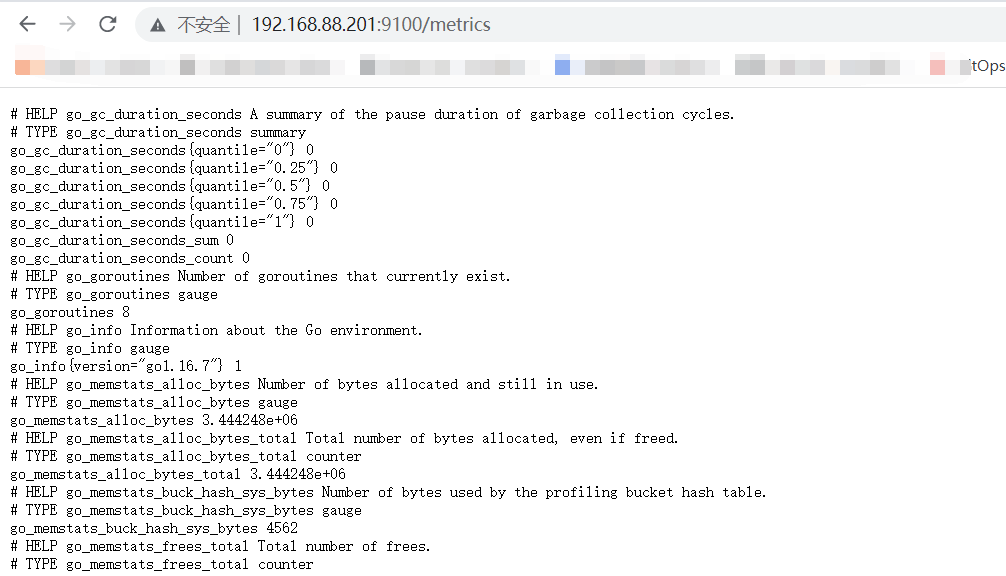
访问node节点的9100:/metrics即可查看node的指标数据
在prometheus服务器上配置采集node节点数据
root@prometheus:/usr/local/prometheus# cat prometheus.yml
scrape_configs:
  # The job name is added as a label `job=<job_name>` to any timeseries scraped from this config.
  - job_name: "prometheus"

    # metrics_path defaults to '/metrics'
    # scheme defaults to 'http'.

    static_configs:
      - targets: ["localhost:9090"]

  - job_name: "nodes"
    static_configs:
      - targets:
        - 192.168.88.201:9100
        - 192.168.88.202:9100
        labels:
          system: linux
root@prometheus:/usr/local/prometheus#


# 重启prometheus
root@prometheus:~# systemctl restart prometheus
访问prometheus web页面查看node1和node2已经添加至prometheus

验证node数据

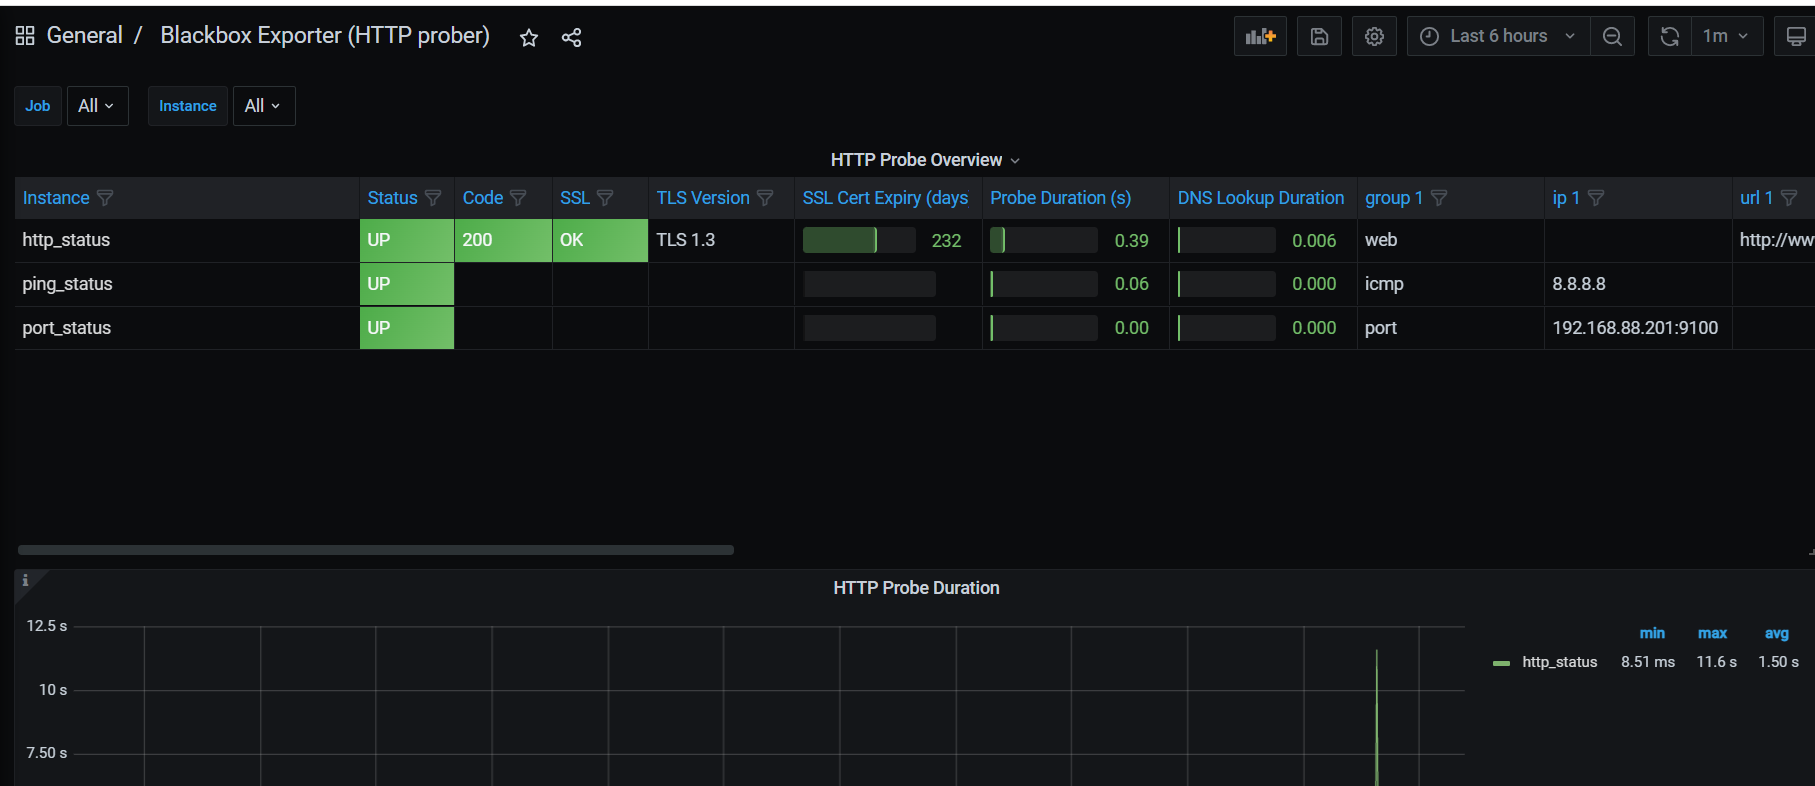
四、prometheus采集blackbox exporter指标数据
blackbox_exporter可以通过HTTP、HTTPS、DNS、TCP和ICMP对被监控节点进行监控和数据采集
HTTP/HTTPS:URL/API 可用性检测
TCP:端口监听检测
ICMP:主机存活性检测
DNS:域名解析检测
1、部署blackbox_exporter
# 解包
root@node1:/usr/local/src# tar xf blackbox_exporter-0.19.0.linux-amd64.tar.gz -C /usr/local/
root@node1:/usr/local/src# cd /usr/local/
root@node1:/usr/local# ls
bin  blackbox_exporter-0.19.0.linux-amd64  etc  games  include  lib  man  sbin  share  src
root@node1:/usr/local# ln -sv blackbox_exporter-0.19.0.linux-amd64/ blackbox_exporter
'blackbox_exporter' -> 'blackbox_exporter-0.19.0.linux-amd64/'
root@node1:/usr/local#


# service启动文件
root@node1:/usr/local/blackbox_exporter# cat > /etc/systemd/system/black-exporter.service << EOF
> [Unit]
> Description=Prometheus Blackbox Exporter
> After=network.target
>
> [Service]
> Type=simple
> User=root
> Group=root
> ExecStart=/usr/local/blackbox_exporter/blackbox_exporter --config.file=/usr/local/blackbox_exporter/blackbox.yml --web.listen-address=:9115
> Restart=on-failure
>
> [Install]
> WantedBy=multi-user.target
> EOF


# blackbox配置文件
root@node1:/usr/local/blackbox_exporter# cat blackbox.yml
modules:
  http_2xx:
    prober: http
  http_post_2xx:
    prober: http
    http:
      method: POST
  tcp_connect:
    prober: tcp
  pop3s_banner:
    prober: tcp
    tcp:
      query_response:
      - expect: "^+OK"
      tls: true
      tls_config:
        insecure_skip_verify: false
  ssh_banner:
    prober: tcp
    tcp:
      query_response:
      - expect: "^SSH-2.0-"
      - send: "SSH-2.0-blackbox-ssh-check"
  irc_banner:
    prober: tcp
    tcp:
      query_response:
      - send: "NICK prober"
      - send: "USER prober prober prober :prober"
      - expect: "PING :([^ ]+)"
        send: "PONG ${1}"
      - expect: "^:[^ ]+ 001"
  icmp:
    prober: icmp


# 启动
root@node1:/usr/local/blackbox_exporter# systemctl daemon-reload
root@node1:/usr/local/blackbox_exporter# systemctl start black-exporter.service
root@node1:/usr/local/blackbox_exporter# netstat -tnlp | grep 9115
tcp6       0      0 :::9115                 :::*                    LISTEN      3211/blackbox_expor
root@node1:/usr/local/blackbox_exporter#
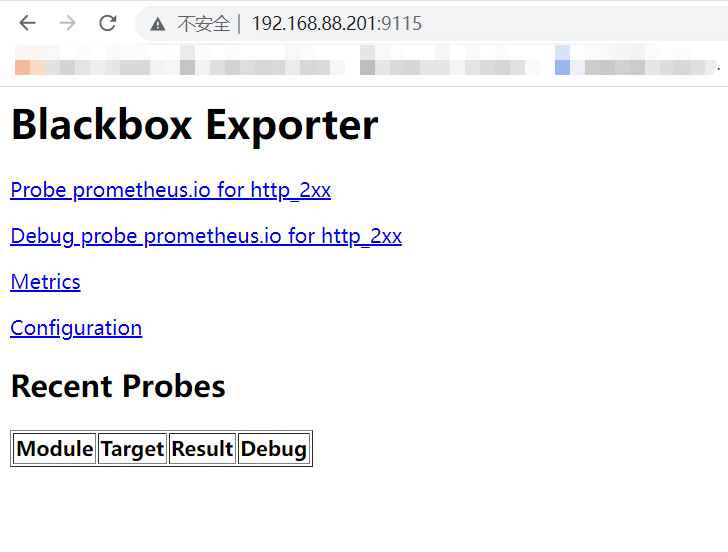
验证web界面
2、blackbox_exporter实现URL监控
prometheus调用blackbox_exporter实现对URL/ICMP的监控
URL监控配置
# prometheus.yml 配置
  - job_name: "http_status"
    metrics_path: /probe
    params:
      module: [http_2xx]
    static_configs:
      - targets: ['http://www.xiaomi.com','http://www.magedu.com']
        labels:
          instance: http_status
          group: web
    relabel_configs:
      - source_labels: [__address__]   # relabel 通过将__address__(当前目标地址)写入__param_target标签来创建一个label
        target_label: __param_target  # 监控目标www.xiaomi.com,作为__address__的value
      - source_labels: [__param_target] # 监控目标
        target_label: url  # 将监控目标与url创建一个label
      - target_label: __address__
        replacement: 192.168.88.201:9115


# 重启prometheus
root@prometheus:/usr/local/prometheus# ./promtool check config prometheus.yml
Checking prometheus.yml
  SUCCESS: 0 rule files found

root@prometheus:/usr/local/prometheus# systemctl restart prometheus
root@prometheus:/usr/local/prometheus#
prometheus验证数据

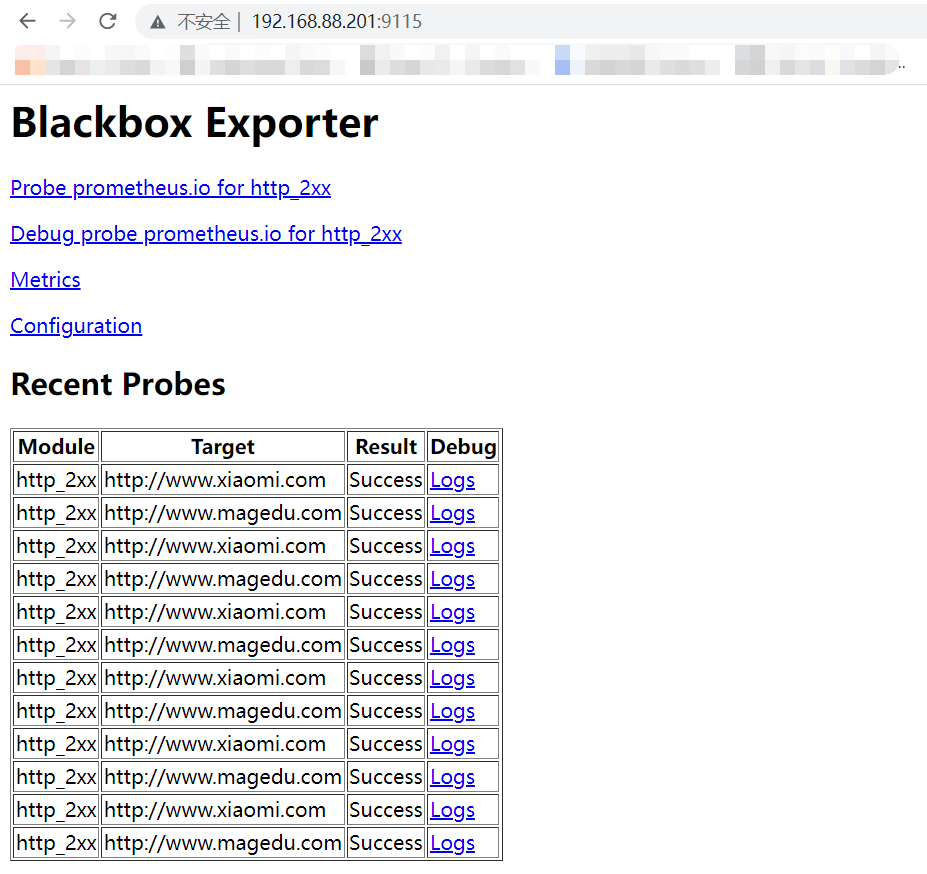
blackbox_exporter界面验证数据
3、blackbox_exporter实现ICMP监控
# prometheus.yml 配置
  - job_name: "ping_status"
    metrics_path: /probe
    params:
      module: [icmp]
    static_configs:
      - targets: ['223.6.6.6', '8.8.8.8']
        labels:
          instance: 'ping_status'
          group: 'icmp'
    relabel_configs:
      - source_labels: [__address__]
        target_label: __param_target
      - source_labels: [__param_target]
        target_label: ip
      - target_label: __address__
        replacement: 192.168.88.201:9115


# 重启prometheus
root@prometheus:/usr/local/prometheus# ./promtool check config prometheus.yml
Checking prometheus.yml
  SUCCESS: 0 rule files found

root@prometheus:/usr/local/prometheus# systemctl restart prometheus
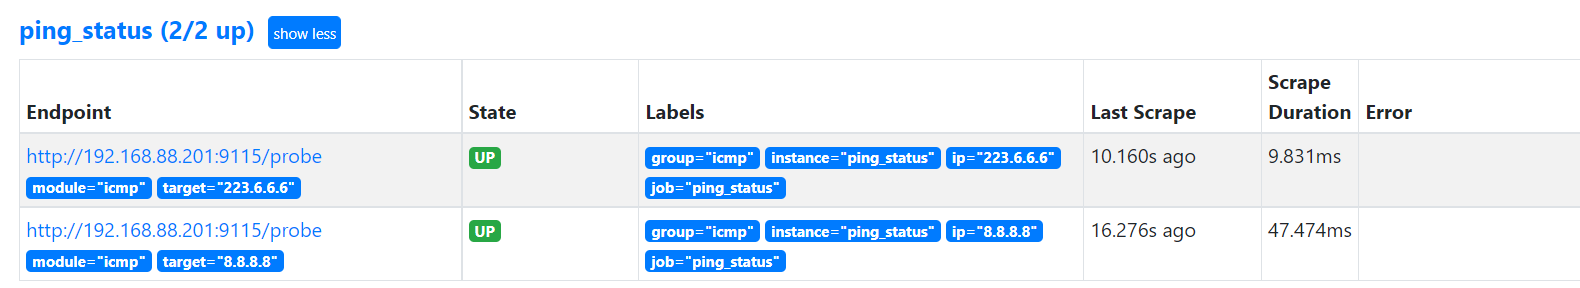
prometheus验证数据
backbox_exporter验证数据

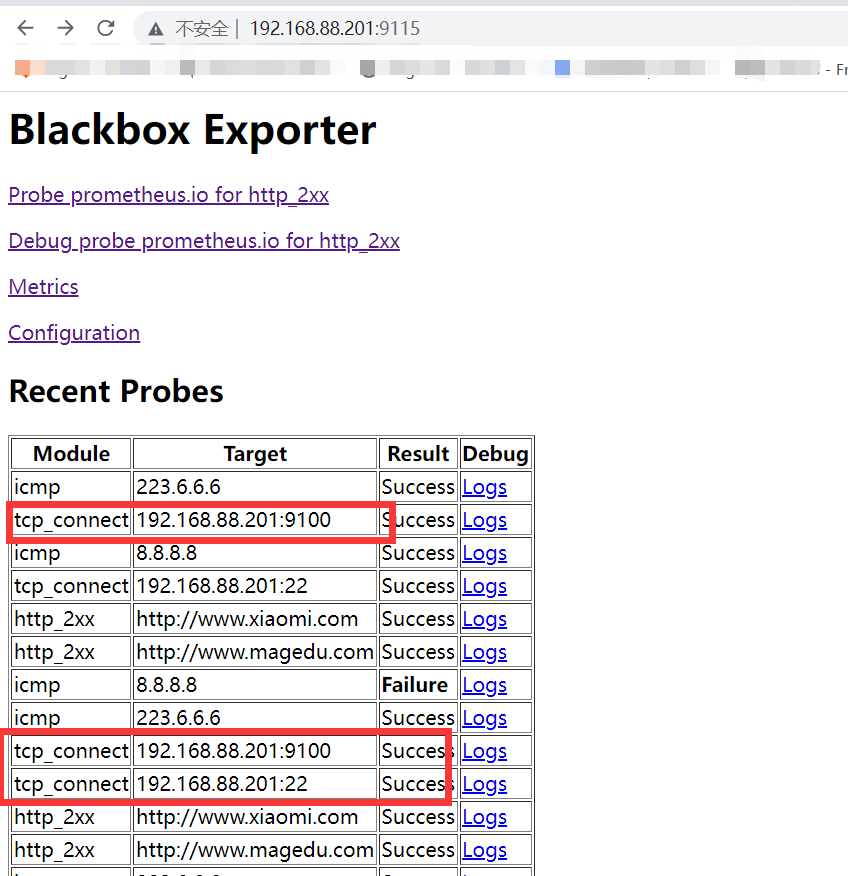
4、blackbox_exporter实现端口监控
# prometheus.yml 配置
  - job_name: "port_status"
    metrics_path: /probe
    params:
      module: [tcp_connect]
    static_configs:
      - targets: ['192.168.88.201:9100', '192.168.88.201:22']
        labels:
          instance: 'port_status'
          group: 'port'
    relabel_configs:
      - source_labels: [__address__]
        target_label: __param_target
      - source_labels: [__param_target]
        target_label: ip
      - target_label: __address__
        replacement: 192.168.88.201:9115


# 重启
root@prometheus:/usr/local/prometheus# ./promtool check config prometheus.yml
Checking prometheus.yml
  SUCCESS: 0 rule files found

root@prometheus:/usr/local/prometheus# systemctl restart prometheus
root@prometheus:/usr/local/prometheus#
prometheus验证数据
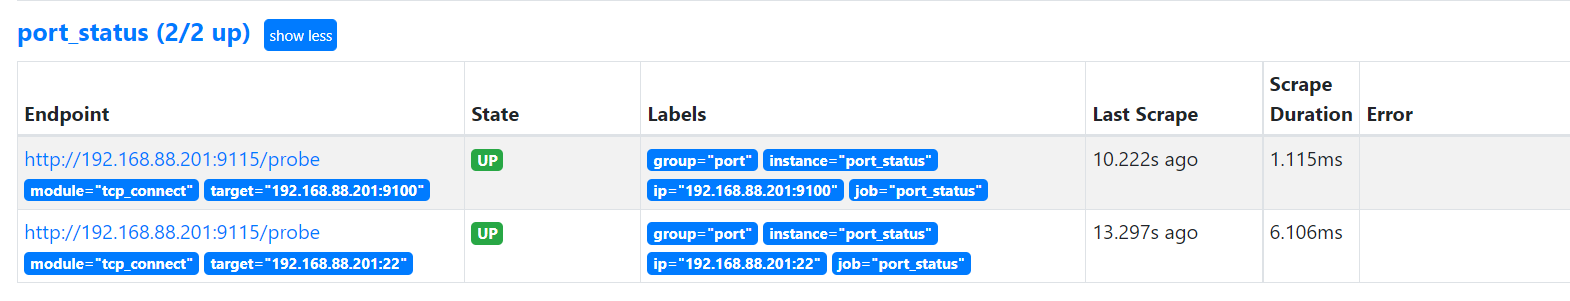
blackbox_exporter验证数据
五、grafana配置
1、安装grafana
# 安装
root@prometheus:~# apt install adduser libfontconfig1 -y
root@prometheus:~# dpkg -i grafana_7.5.11_amd64.deb


# grafana.ini 配置文件
root@prometheus:~# vim /etc/grafana/grafana.ini
[server]
# Protocol (http, https, h2, socket)
protocol = http

# The ip address to bind to, empty will bind to all interfaces
http_addr = 0.0.0.0

# The http port  to use
http_port = 3000


# 启动
root@prometheus:~# systemctl restart grafana-server.service
root@prometheus:~# systemctl enable grafana-server.service
Synchronizing state of grafana-server.service with SysV service script with /lib/systemd/systemd-sysv-install.
Executing: /lib/systemd/systemd-sysv-install enable grafana-server
Created symlink /etc/systemd/system/multi-user.target.wants/grafana-server.service → /lib/systemd/system/grafana-server.service.
root@prometheus:~#
登录web界面

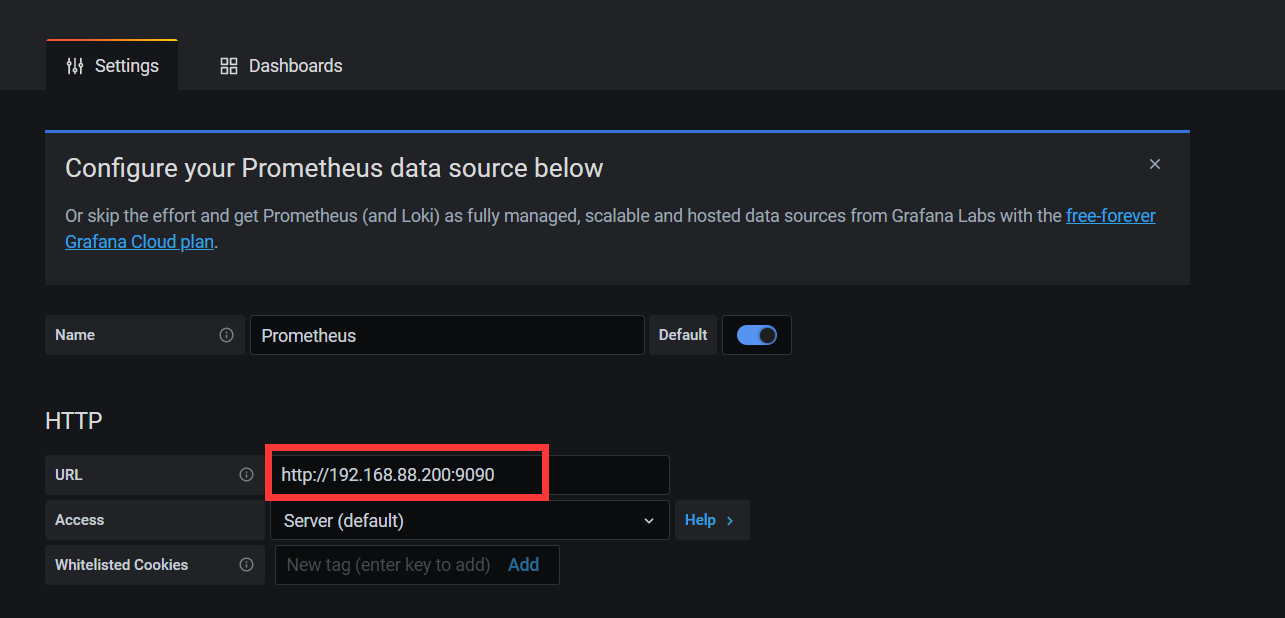
添加数据源


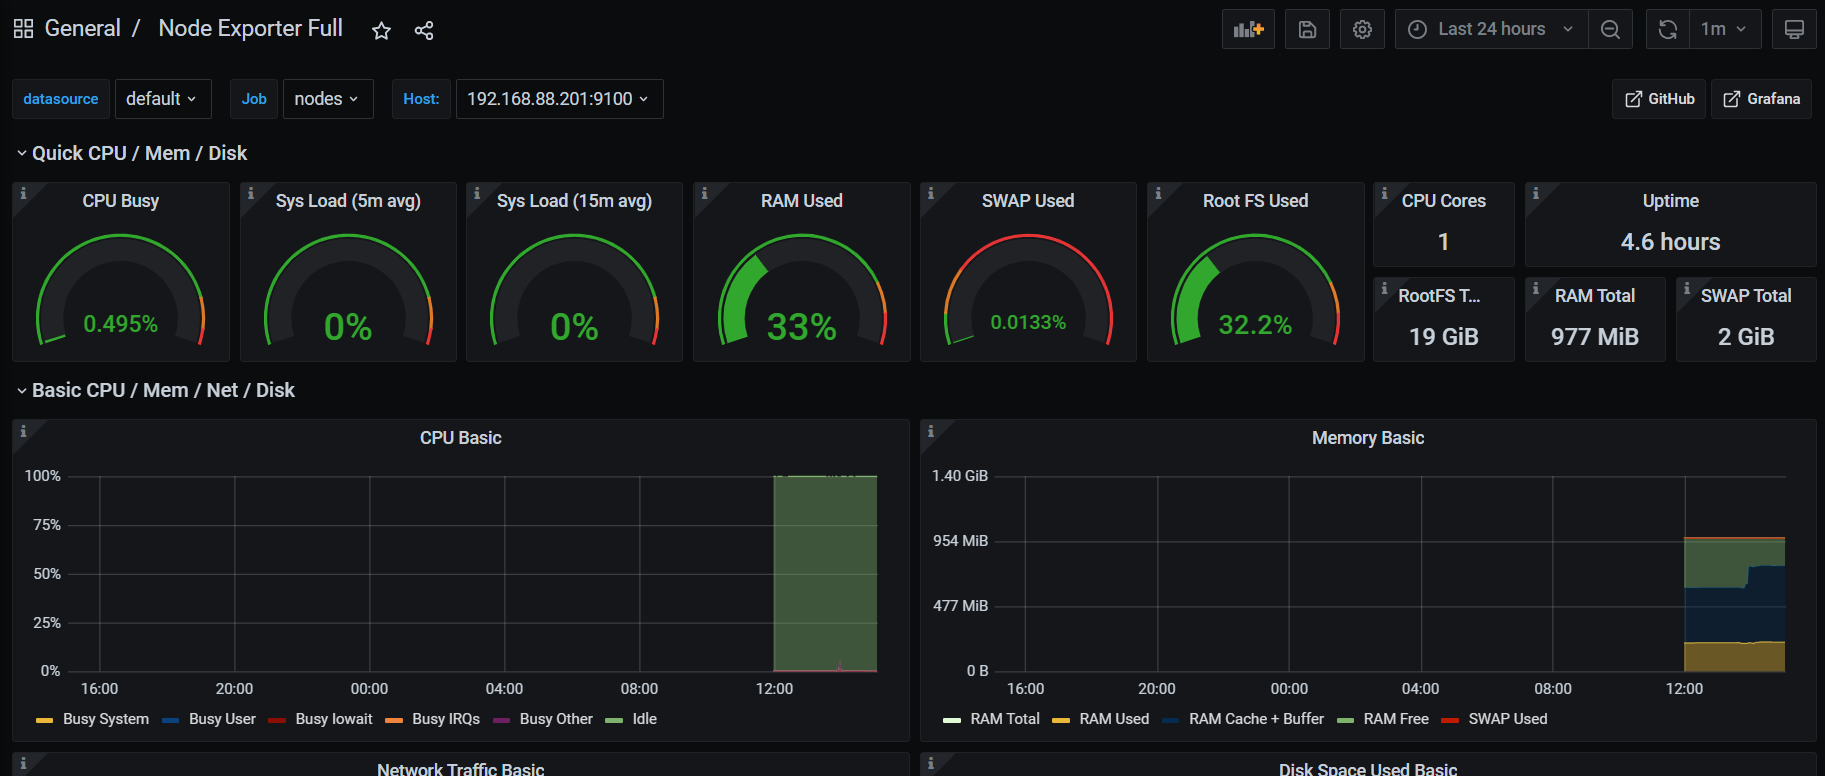
2、导入node_exporter模板
搜索模板
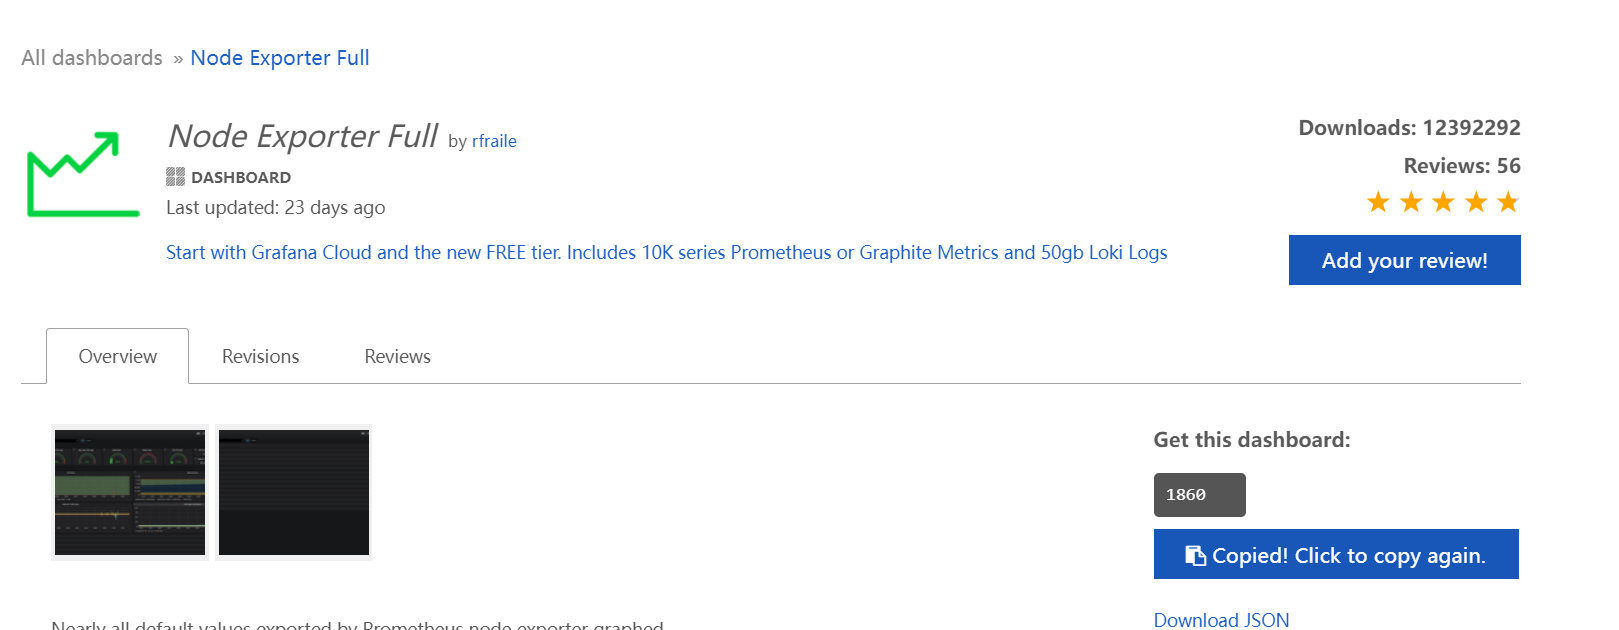
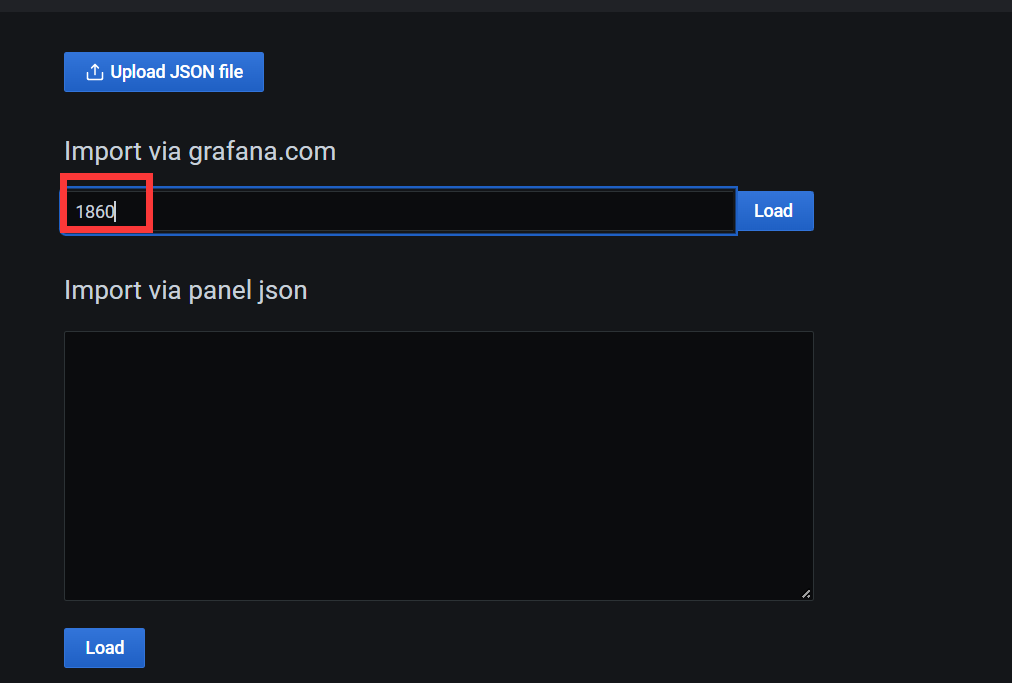
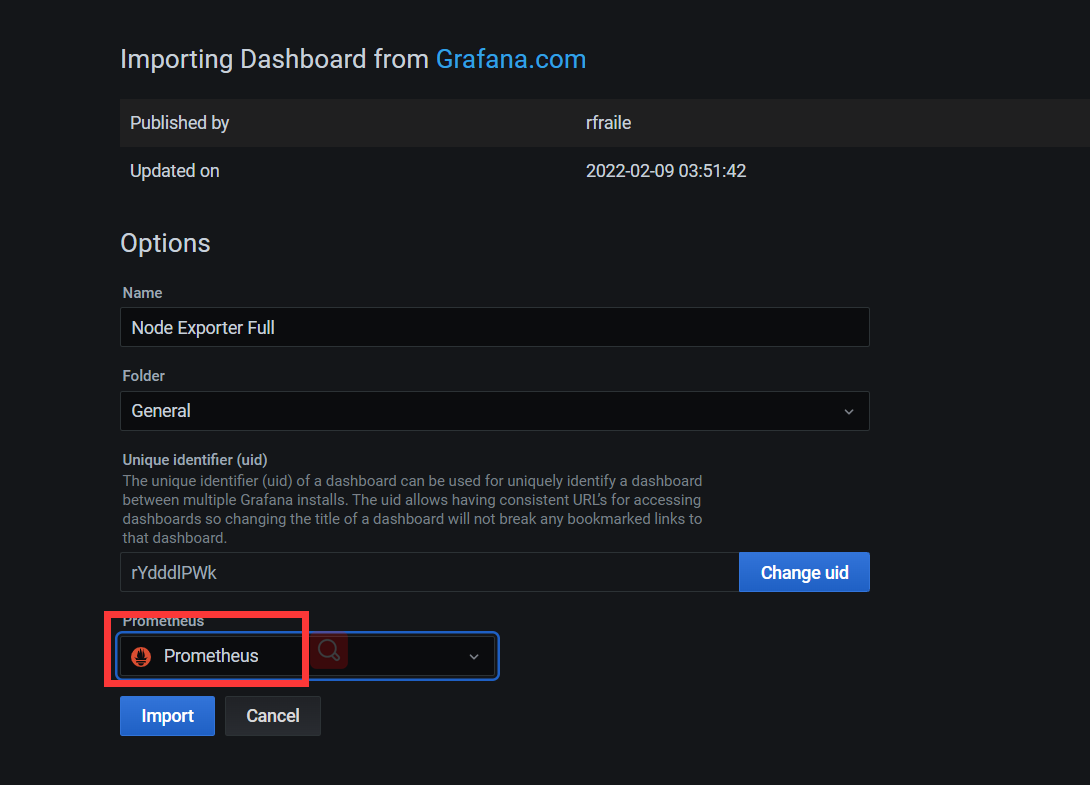
导入模板-1860
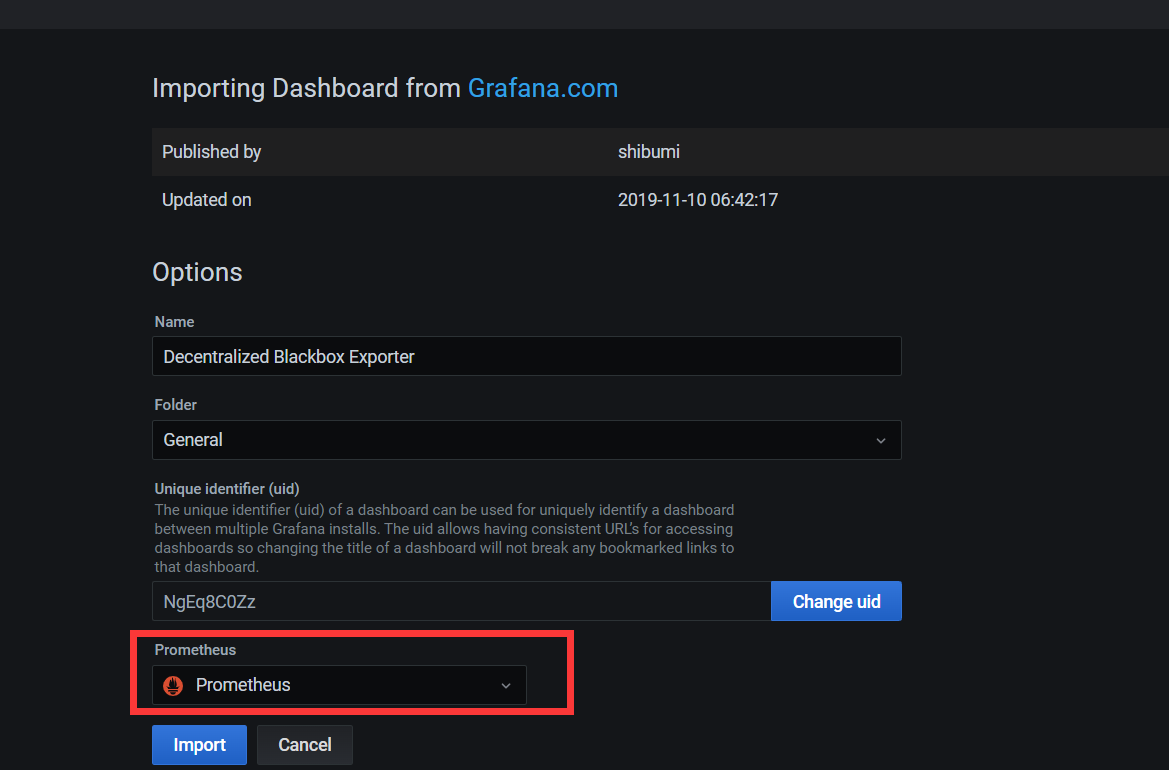
3、导入blackbox_exporter模板
导入模板-13659

 浙公网安备 33010602011771号