

Understanding ROC, AUC, and F1 Score Metrics
Context in a Confusion Matrix
In classification tasks, results are often summarized in a confusion matrix:
| Predicted Positive | Predicted Negative | |
|---|---|---|
| Actual Positive | True Positive (TP) | False Negative (FN) |
| Actual Negative | False Positive (FP) | True Negative (TN) |
注:末尾的字母是机器的预测值(即列),首字母是对预测值的判断(即行)
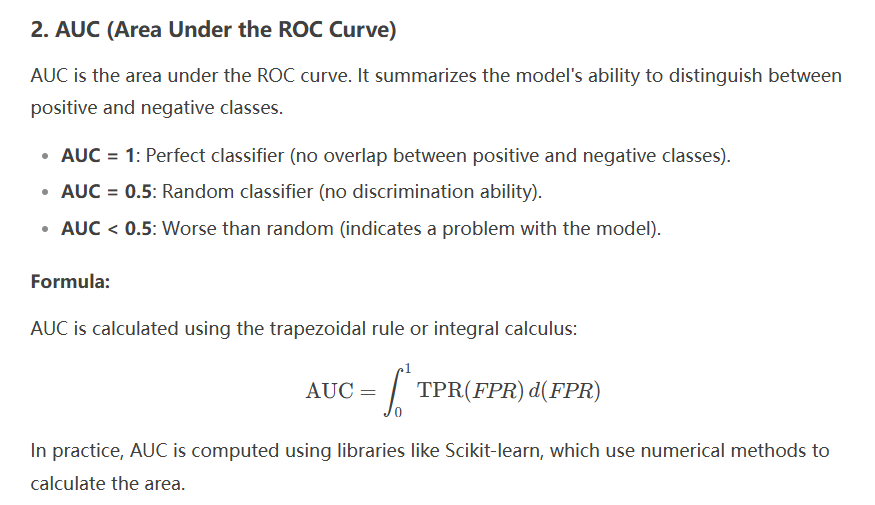
1. ROC Curve (Receiver Operating Characteristic Curve)
The ROC curve is created by plotting:
-
True Positive Rate (TPR) on the y-axis.
-
False Positive Rate (FPR) on the x-axis.
Formulas:
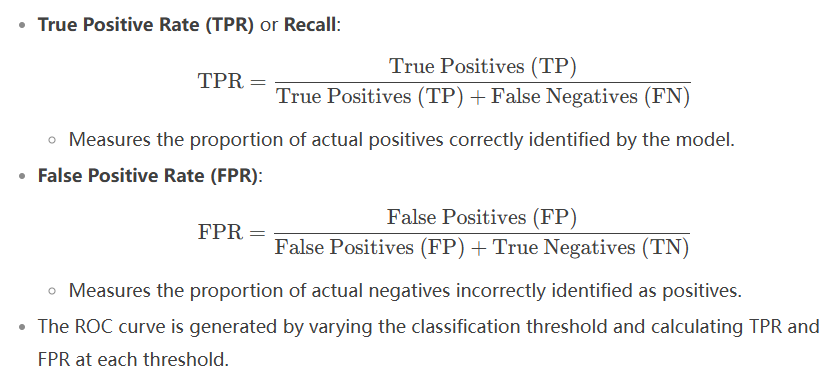
注:这两个尺度是以模型所有的Postive预测为基准,测量模型,再详细点就是,当模型预测postive为正确时,当模型预测postive为错误时(表格第一列的两种情况)。TPR分母都是事实上的Positive,FPR分母都是事实上的Negative(即表格两行分别的和)。
注:Recall 和 FPR是同一个东西
本文来自博客园,作者:z_s_s,转载请注明原文链接:https://www.cnblogs.com/zhoushusheng/p/18735268

 浙公网安备 33010602011771号