

Prometheus + Grafana 监控平台搭建
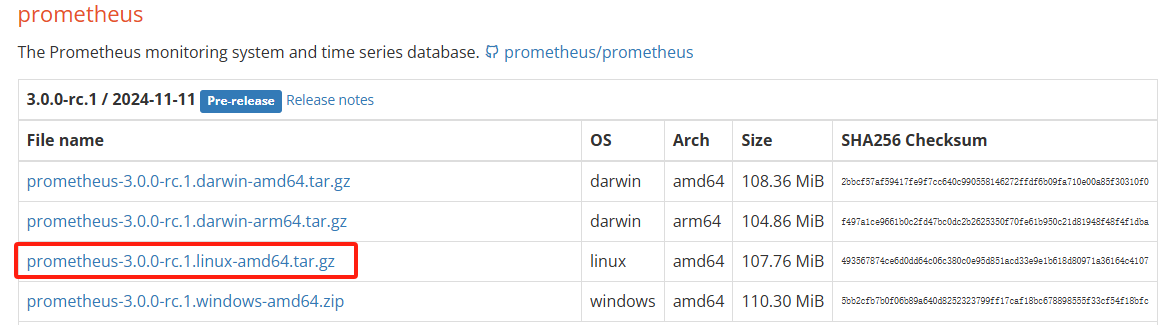
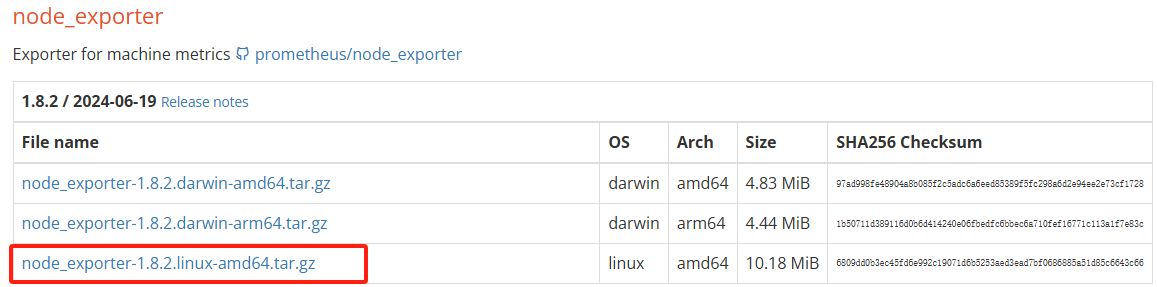
1、下载 prometheus和node_exporter:https://prometheus.io/download/
下载完后上传到服务器
解压
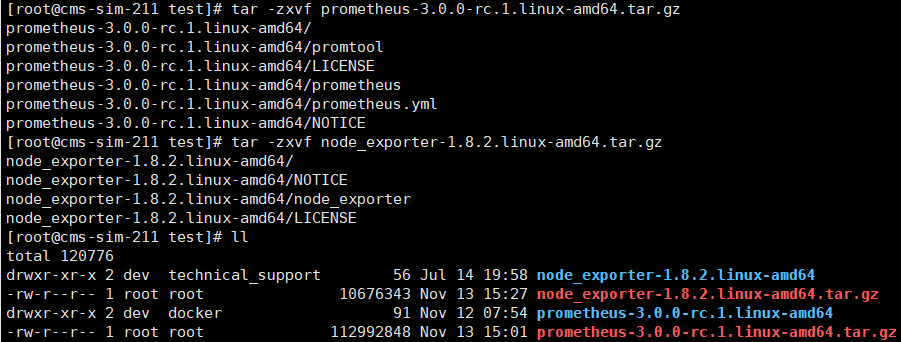
tar -zxvf prometheus-3.0.0-rc.1.linux-amd64.tar.gz
tar -zxvf node_exporter-1.8.2.linux-amd64.tar.gz
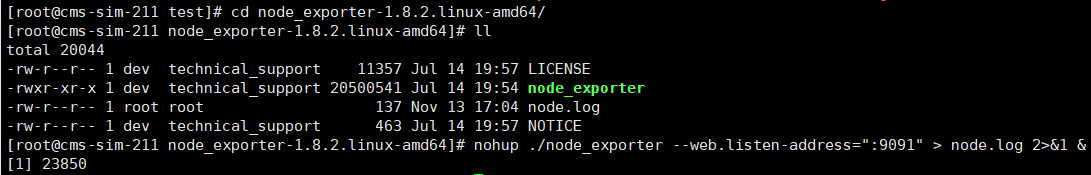
2、启动 node_exporter
nohup ./node_exporter --web.listen-address=":9091" > node.log 2>&1 &
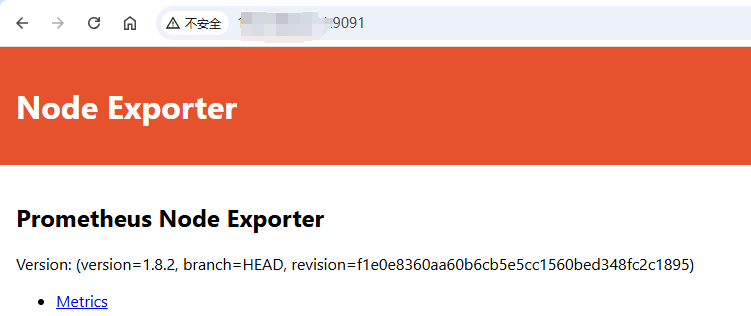
浏览器输入ip:9091即可访问到
3、启动 prometheus
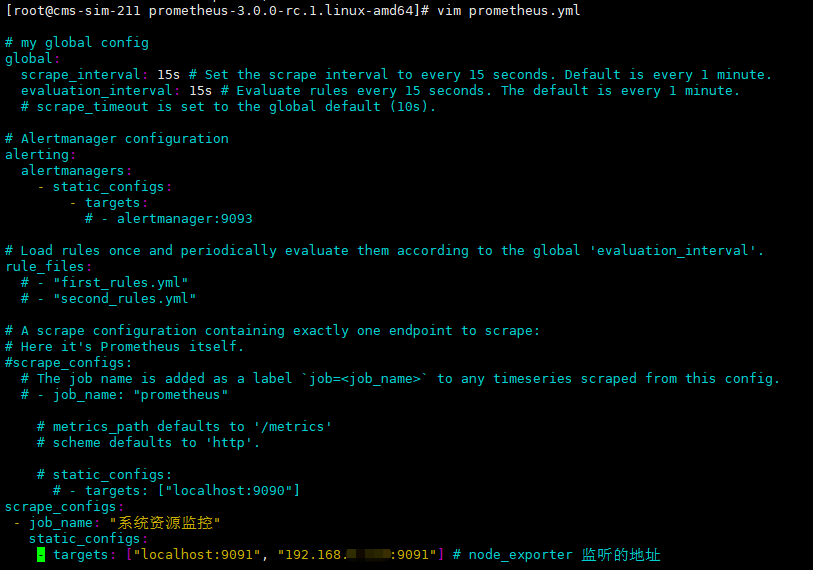
修改prometheus的配置文件
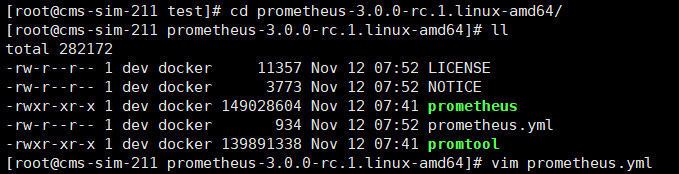
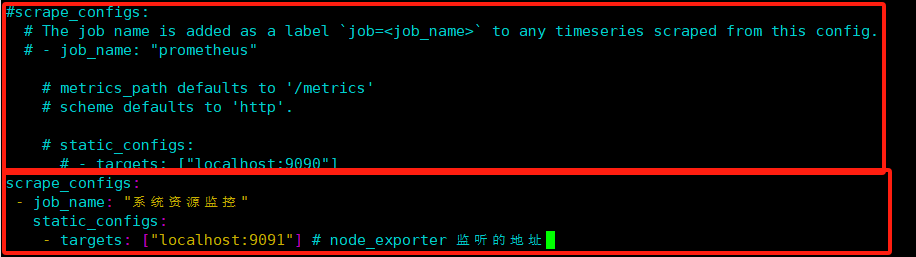
把原来的scrape_configs下的内容注释掉,改为以下内容,注意缩进!!
如果要监控多台服务器,在targets里面填上对应服务器的node_exporter的地址+端口就行
scrape_configs:
- job_name: "系统资源监控"
static_configs:
- targets: ["localhost:9091"] # node_exporter 监听的地址
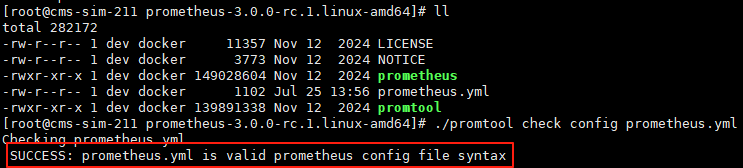
使用prometheus提供的工具验证配置文件语法是否正确:./promtool check config prometheus.yml
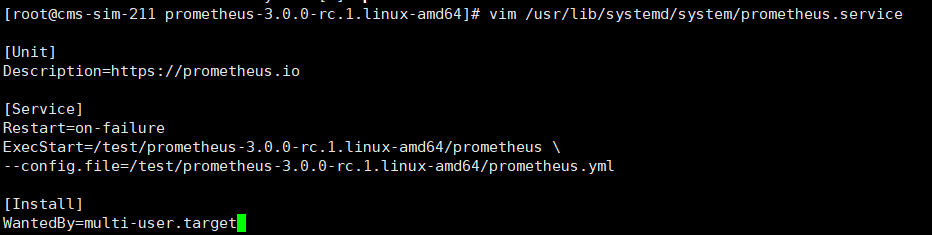
为了方便启动、停止、查看状态,用服务的形式启动prometheus
vim /usr/lib/systemd/system/prometheus.service
输入以下内容,主要是指定刚刚解压后的prometheus可执行文件和配置
[Unit]
Description=https://prometheus.io
[Service]
Restart=on-failure
ExecStart=/test/prometheus-3.0.0-rc.1.linux-amd64/prometheus \
--config.file=/test/prometheus-3.0.0-rc.1.linux-amd64/prometheus.yml
[Install]
WantedBy=multi-user.target
保存之后,就可以使用命令启动服务了
启动:systemctl start prometheus
停止:systemctl stop prometheus
查看状态:systemctl status prometheus
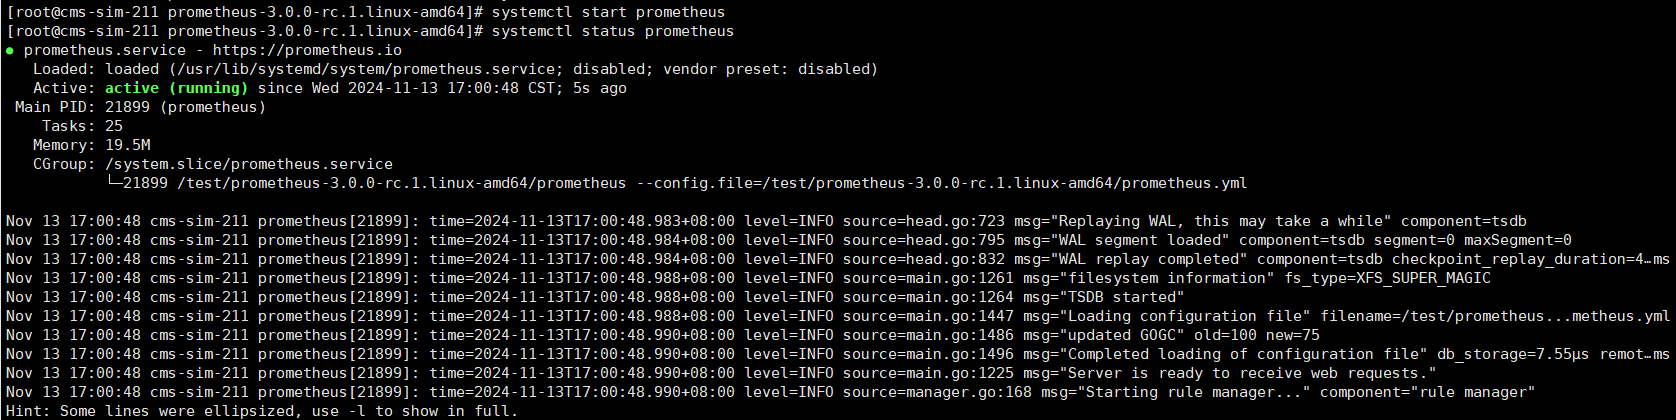
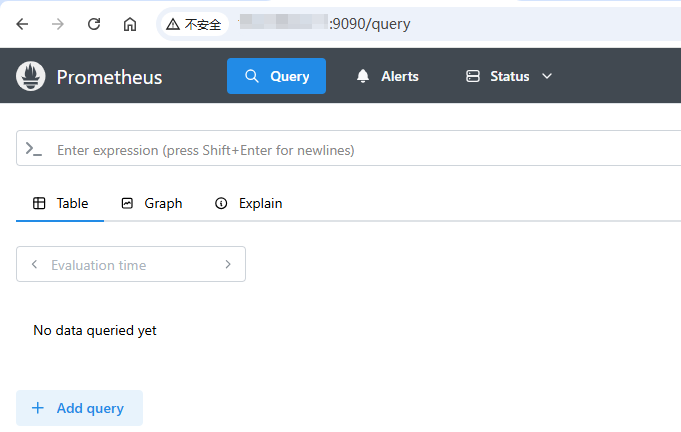
浏览器输入ip:9090就可以访问到
4、安装grafana
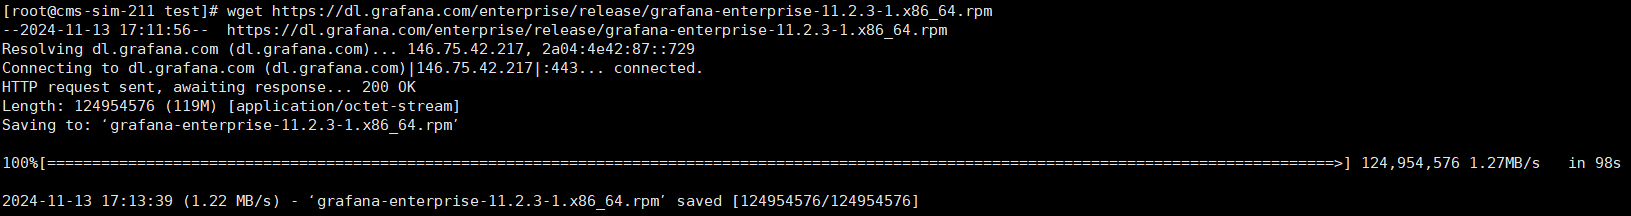
下载安装
wget https://dl.grafana.com/enterprise/release/grafana-enterprise-11.2.3-1.x86_64.rpm
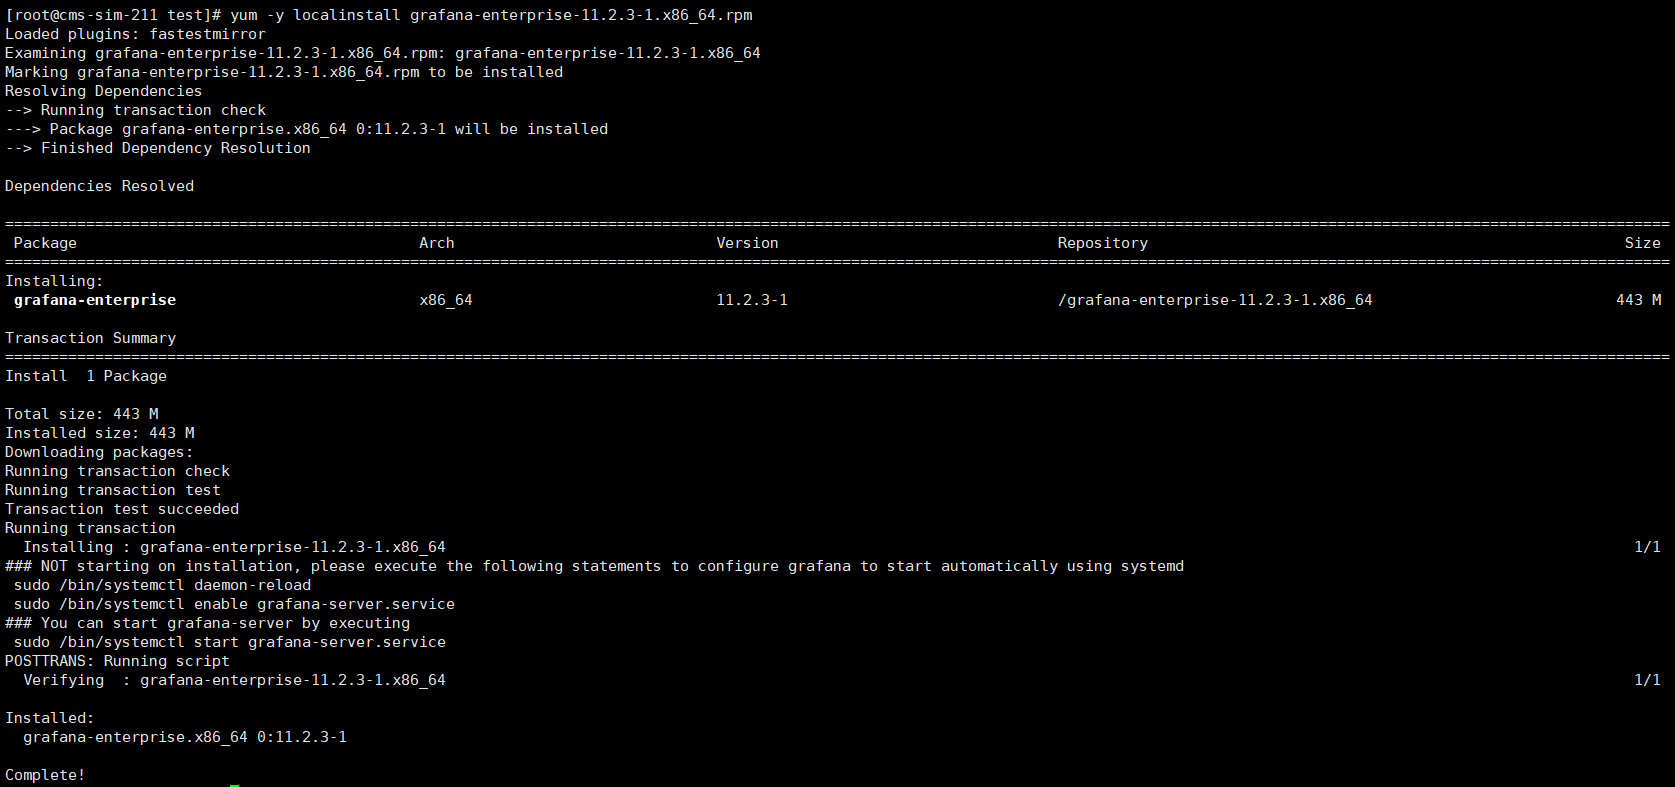
yum -y localinstall grafana-enterprise-11.2.3-1.x86_64.rpm
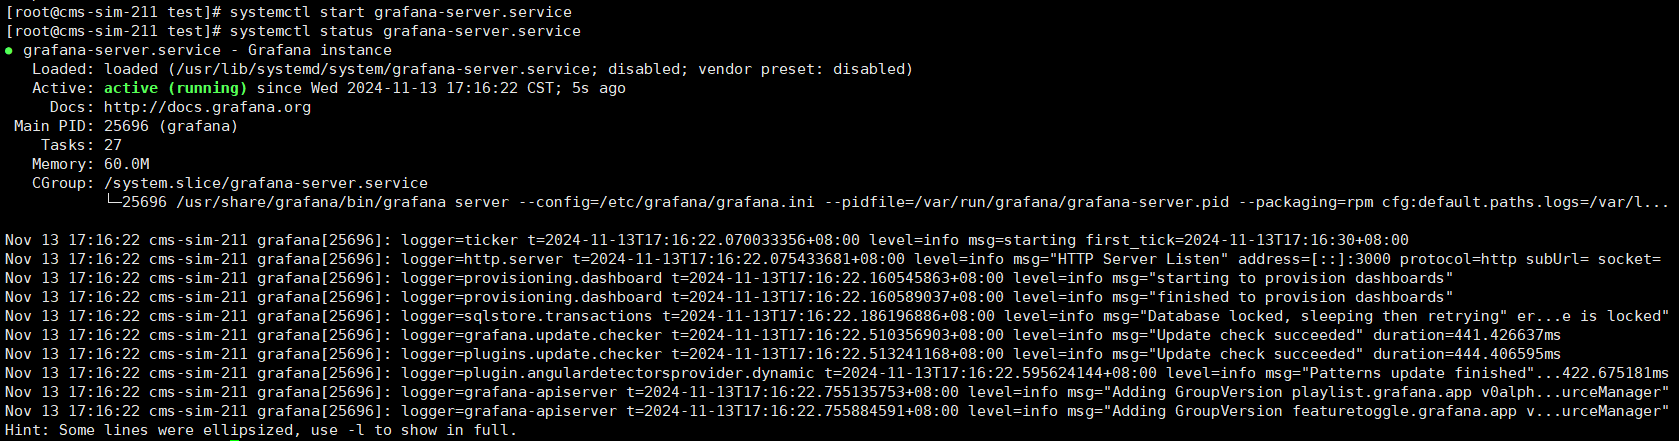
启动服务:systemctl start grafana-server.service
停止服务:systemctl stop grafana-server.service
查看状态:systemctl status grafana-server.service
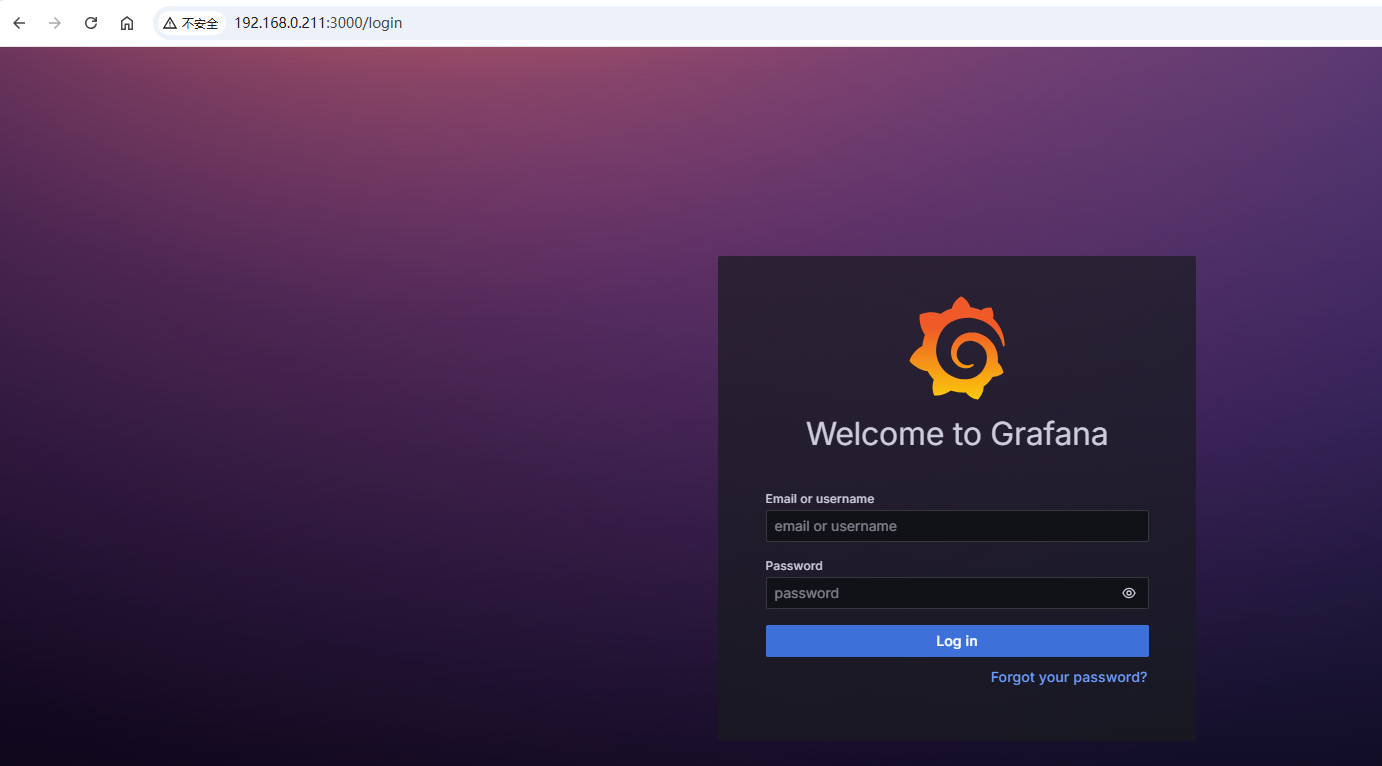
浏览器输入ip:3000即可访问,默认账号密码均为admin
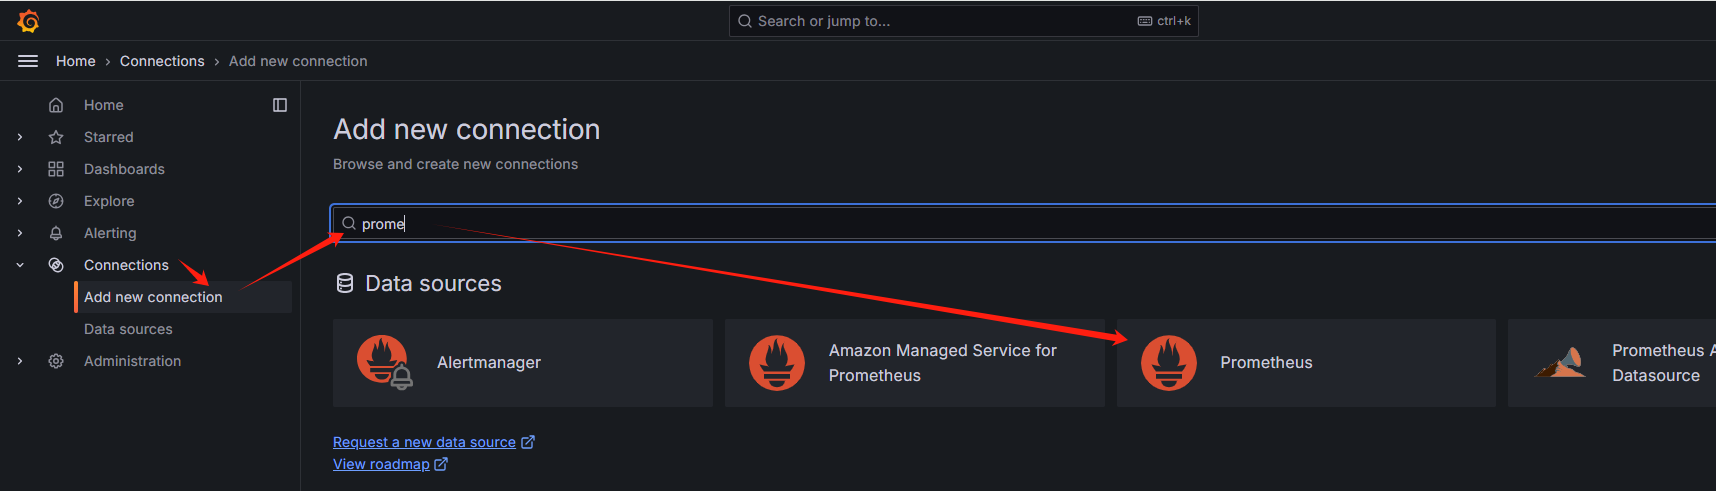
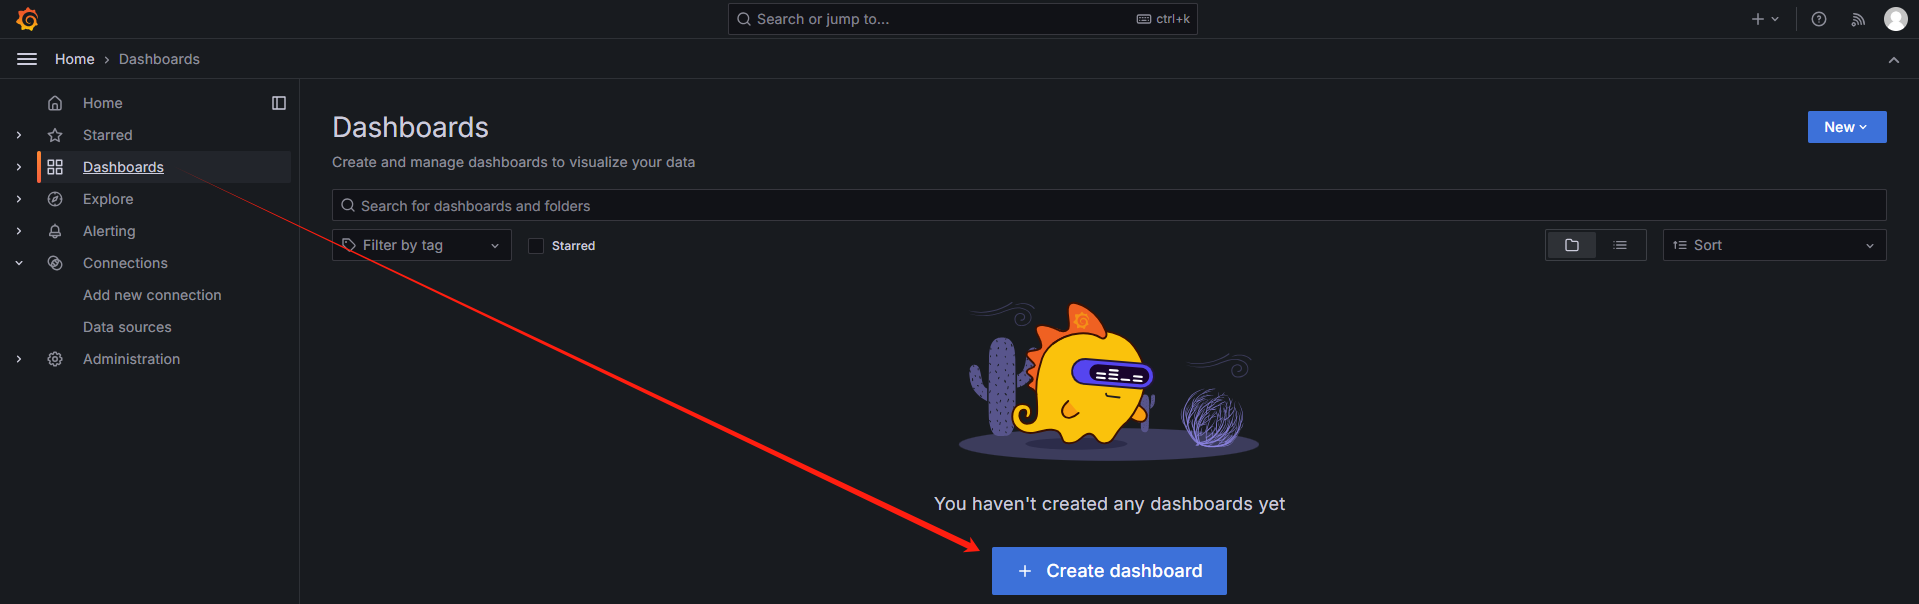
5、配置 grafana 从 prometheus 拿数据,并渲染成图表
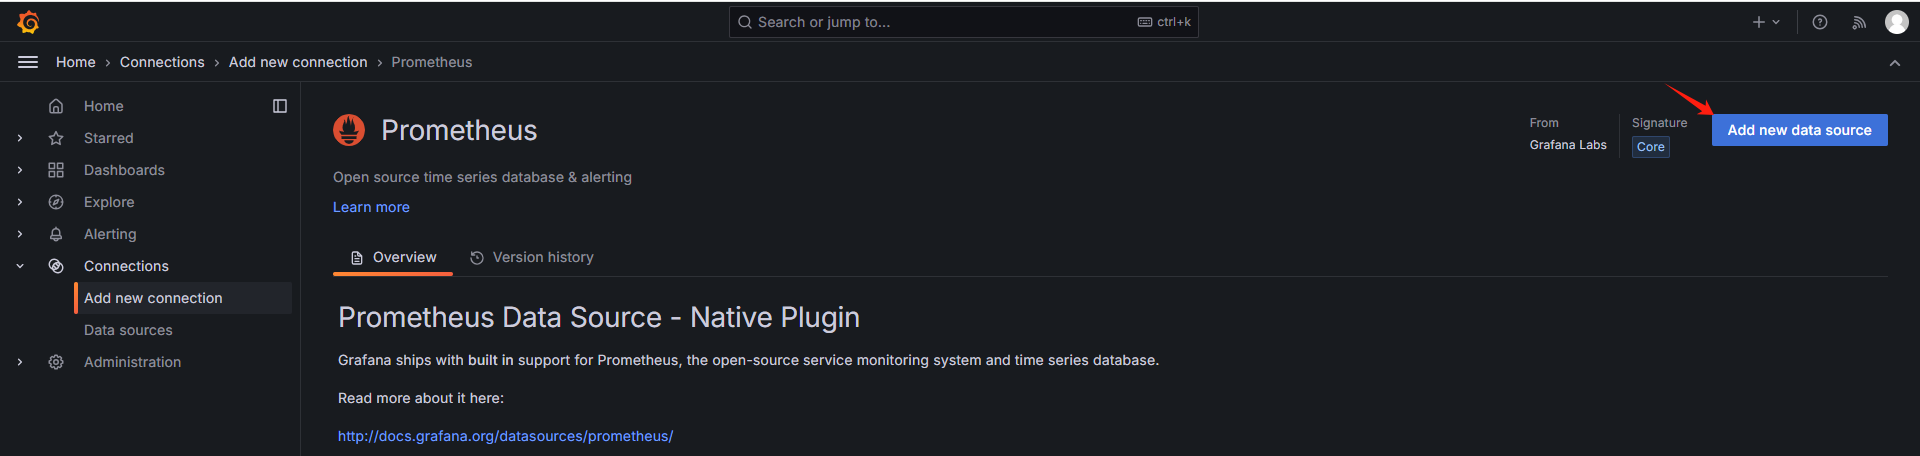
创建连接,选择prometheus
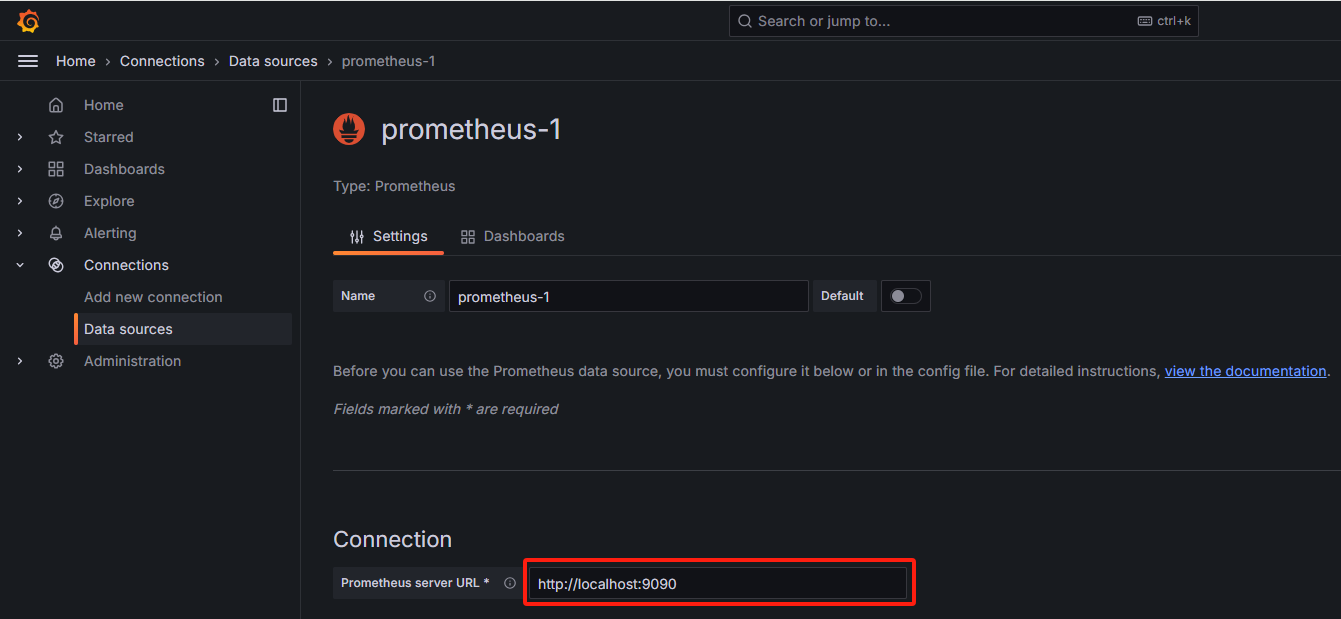
填入prometheus的访问地址,其他都不用管,滑到最下面,点测试

选择Dashboard
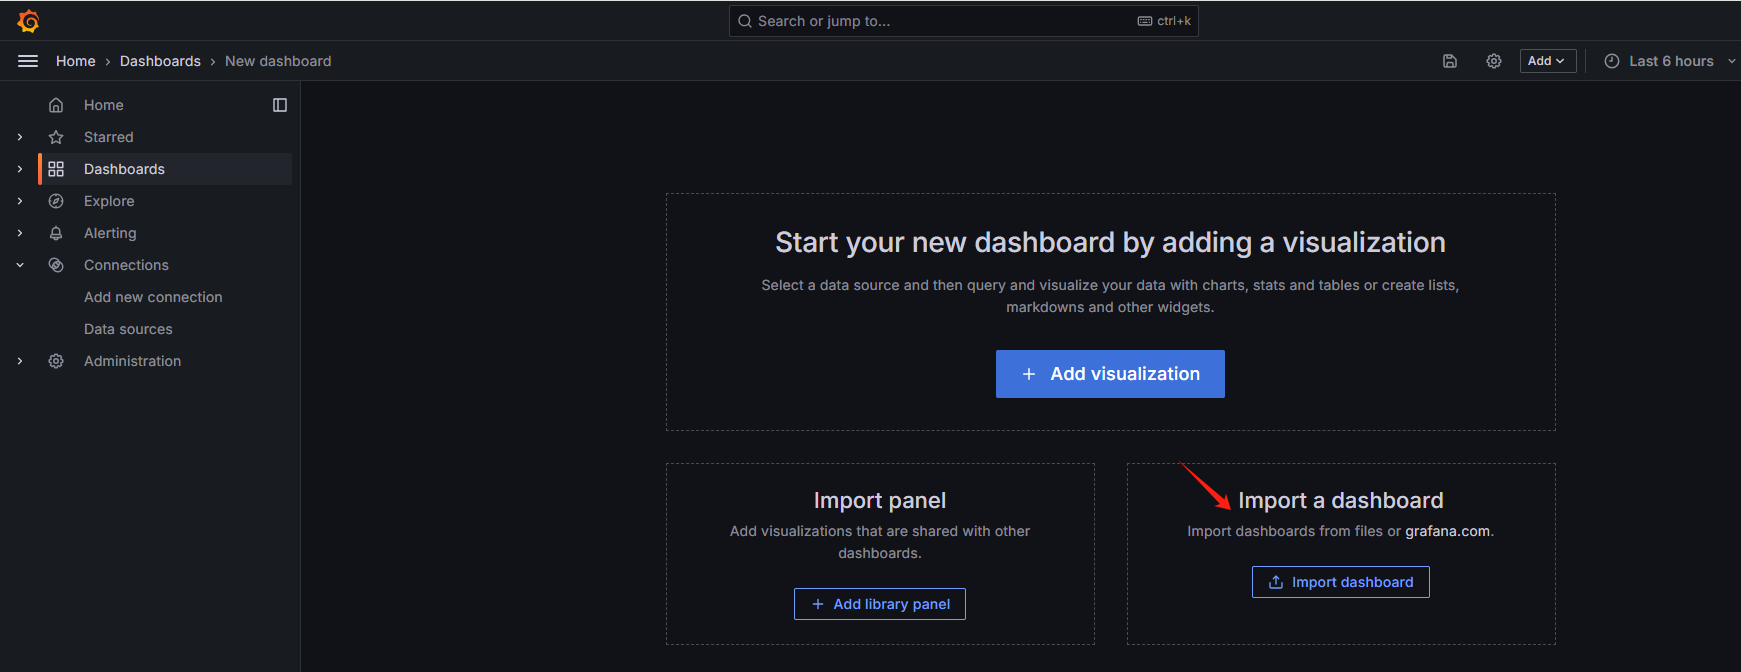
点击页面上提供的地址,grafana提供了非常多的模板,只需要进去下载,再在这里导入即可
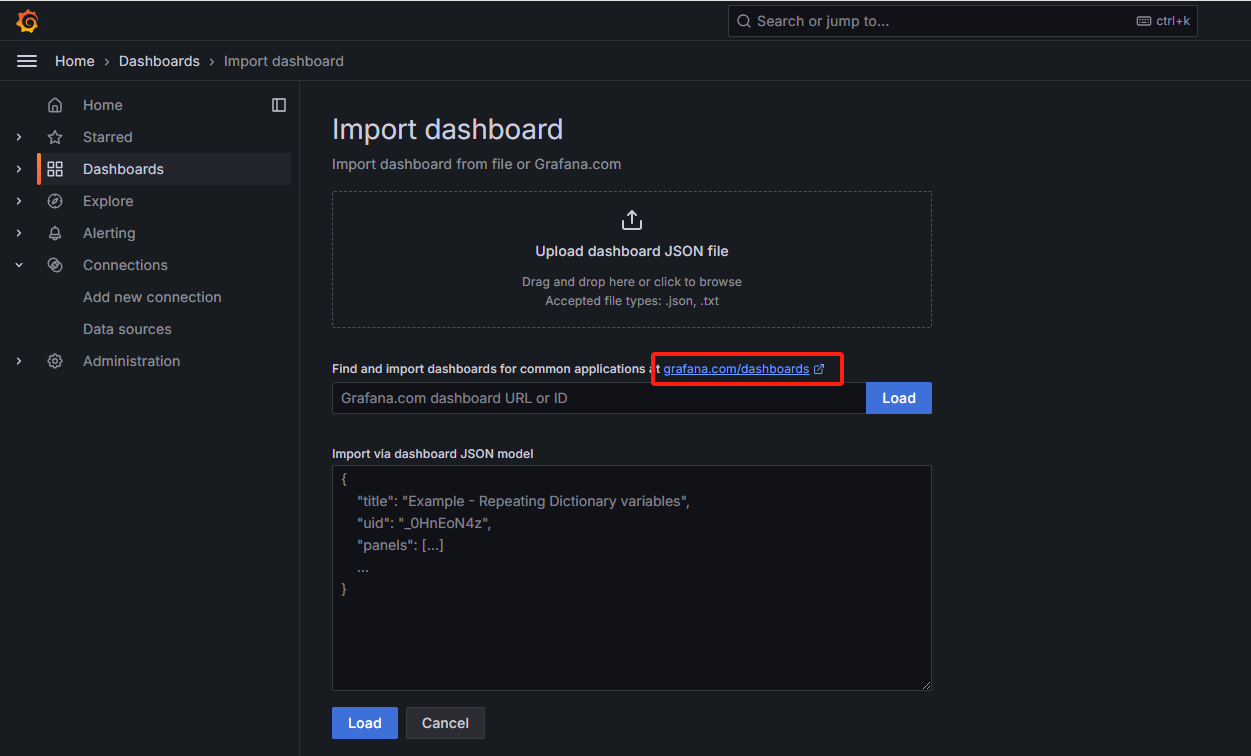
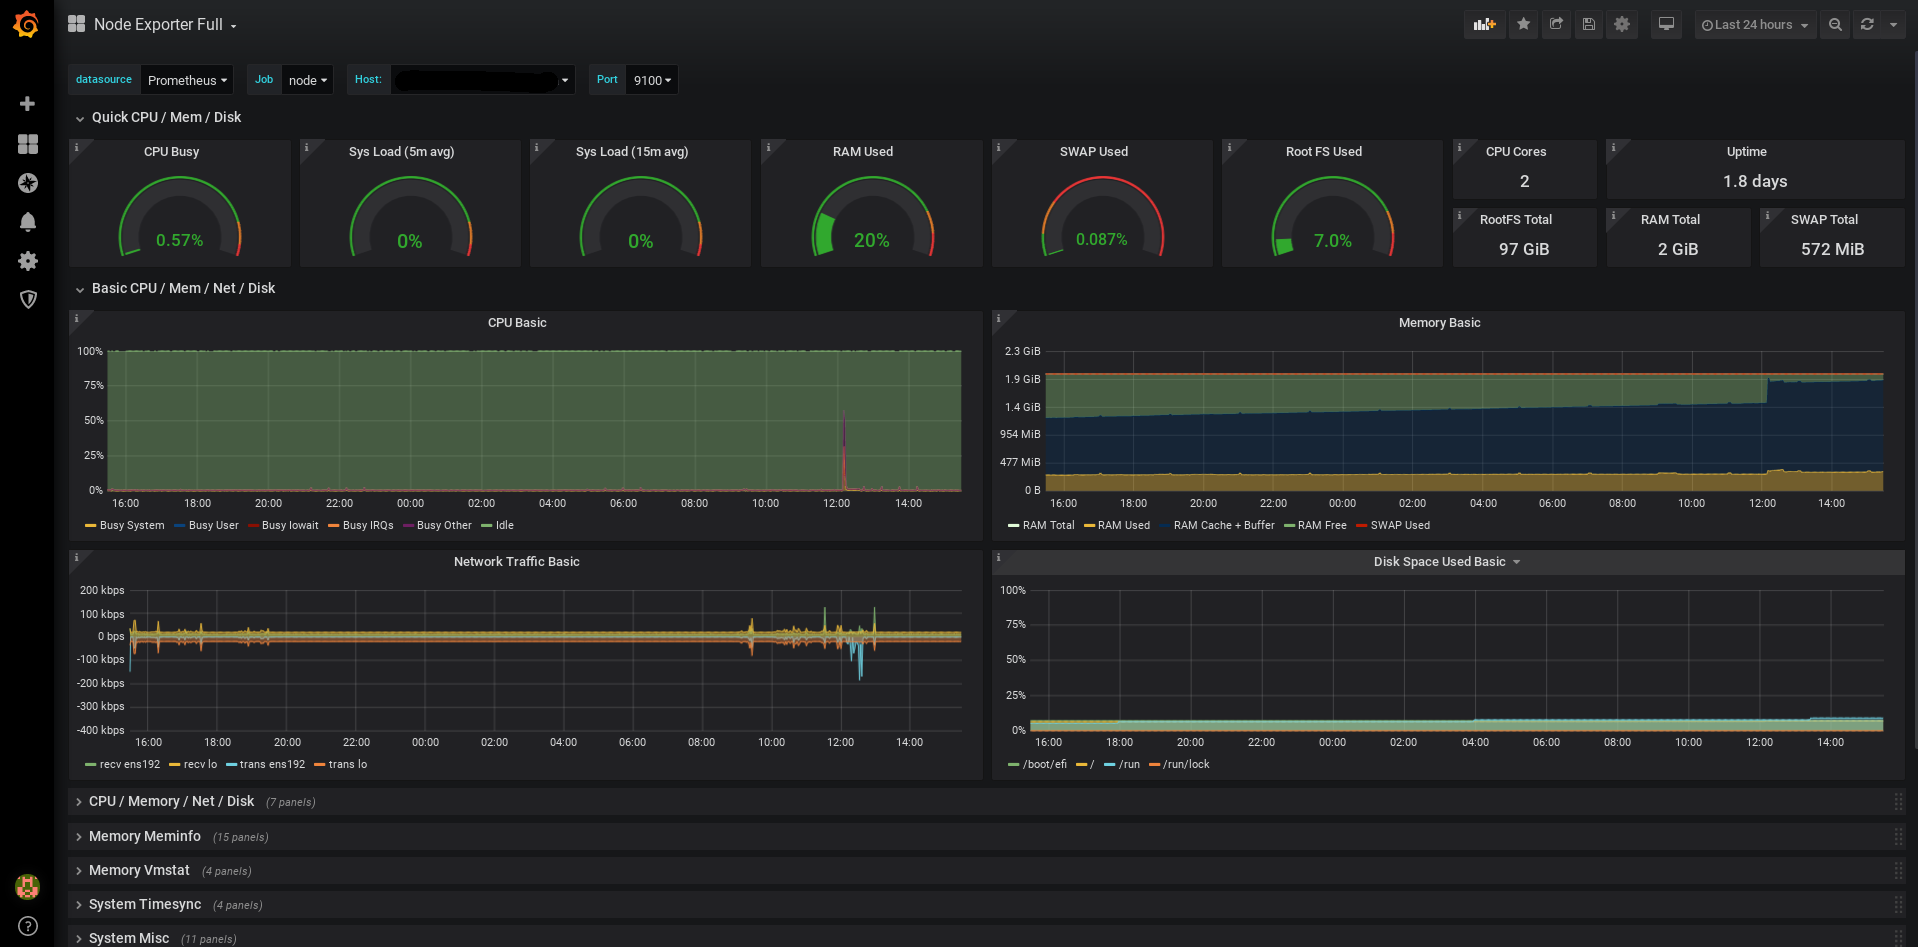
如选择 node-exporter-full 这个模板,只需要点击进入详情,下载json
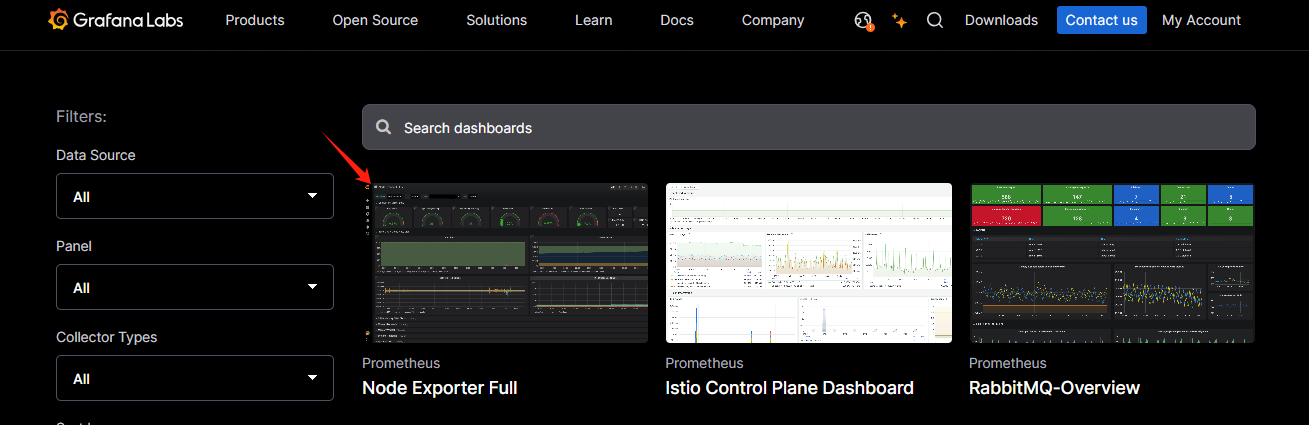
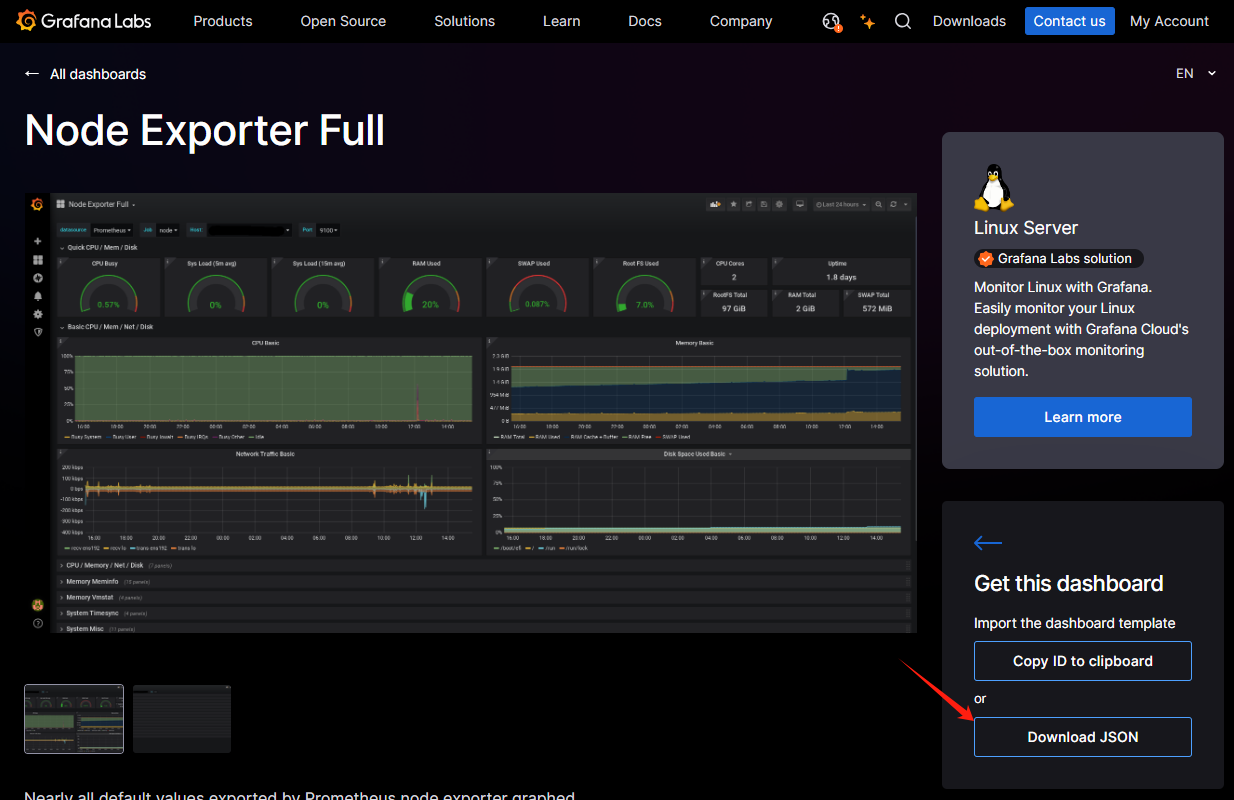
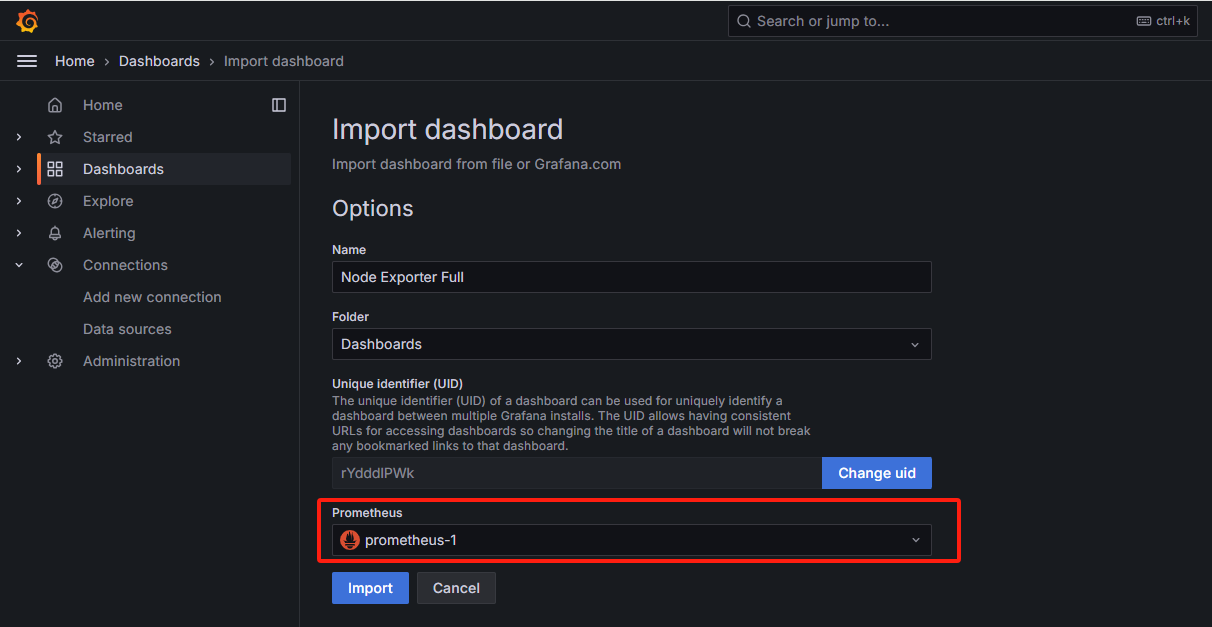
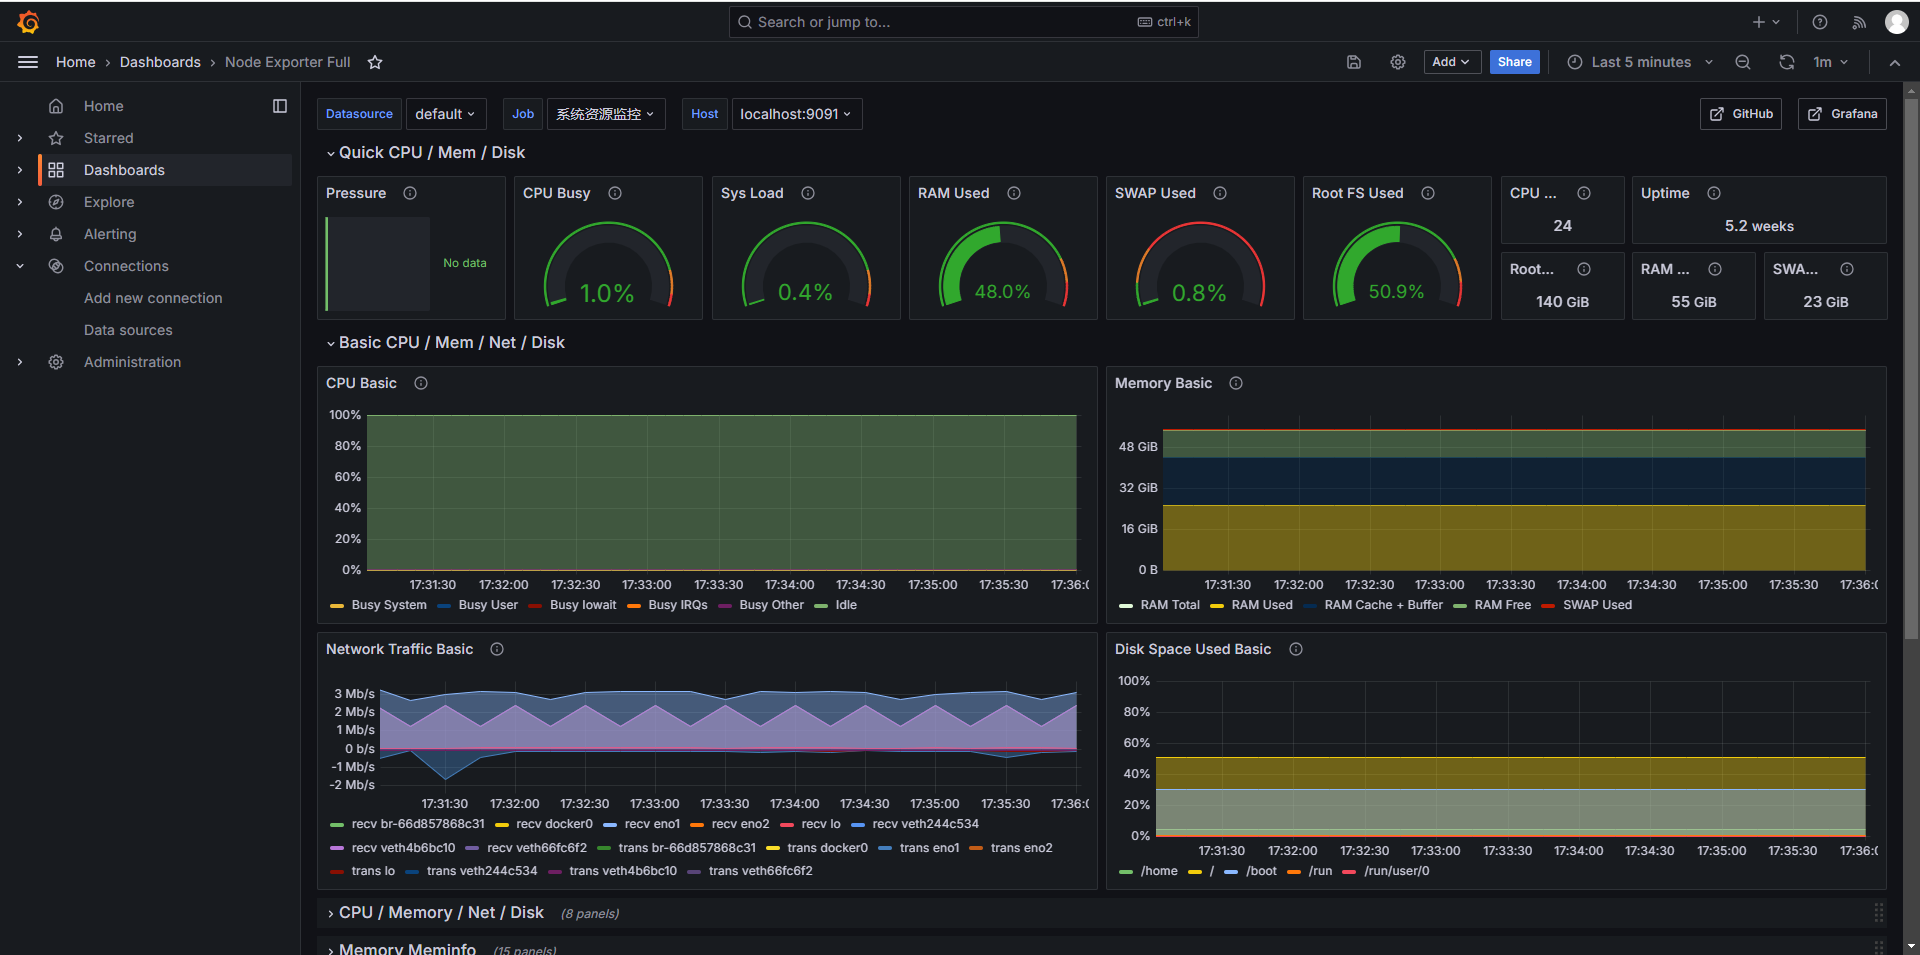
再在grafana刚刚那个页面导入即可,选择前面创建的数据,确认导入
grafna设置中文
编辑配置文件,比如我这里是 vim /etc/grafana/grafana.ini

在配置文件的507行,[users]下的;default_language = en-US 改为 default_language = zh-Hans
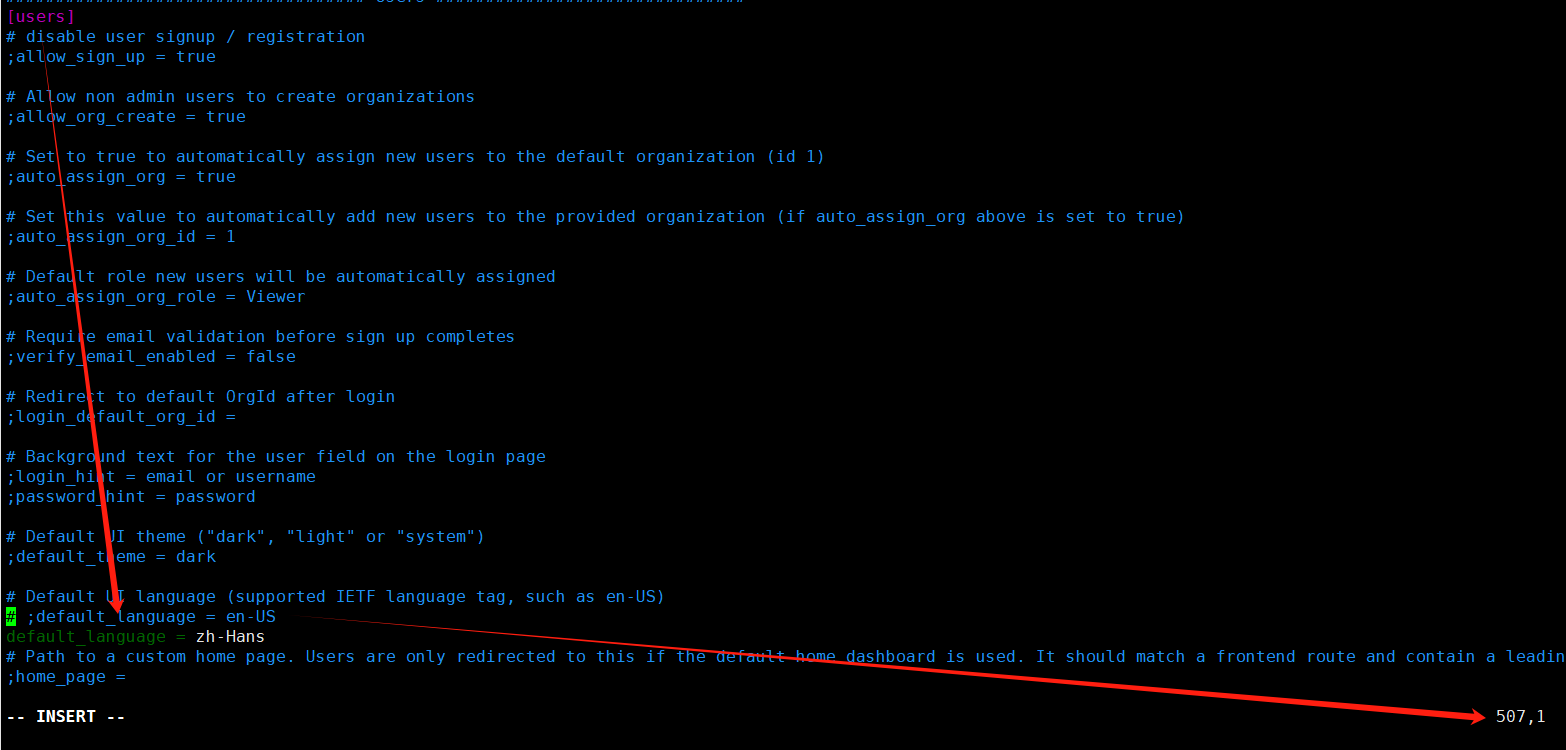
systemctl restart grafana-server.service 重启再访问,即可看到页面已经是中文了

如果要监控多个服务器的资源,只需要在 所有需要监控的服务器都装上node_exporter并启动,然后在prometheus.yml加上这些node_exporter的地址再重启prometheus就行
重启prometheus后刷新grafana页面就可以了

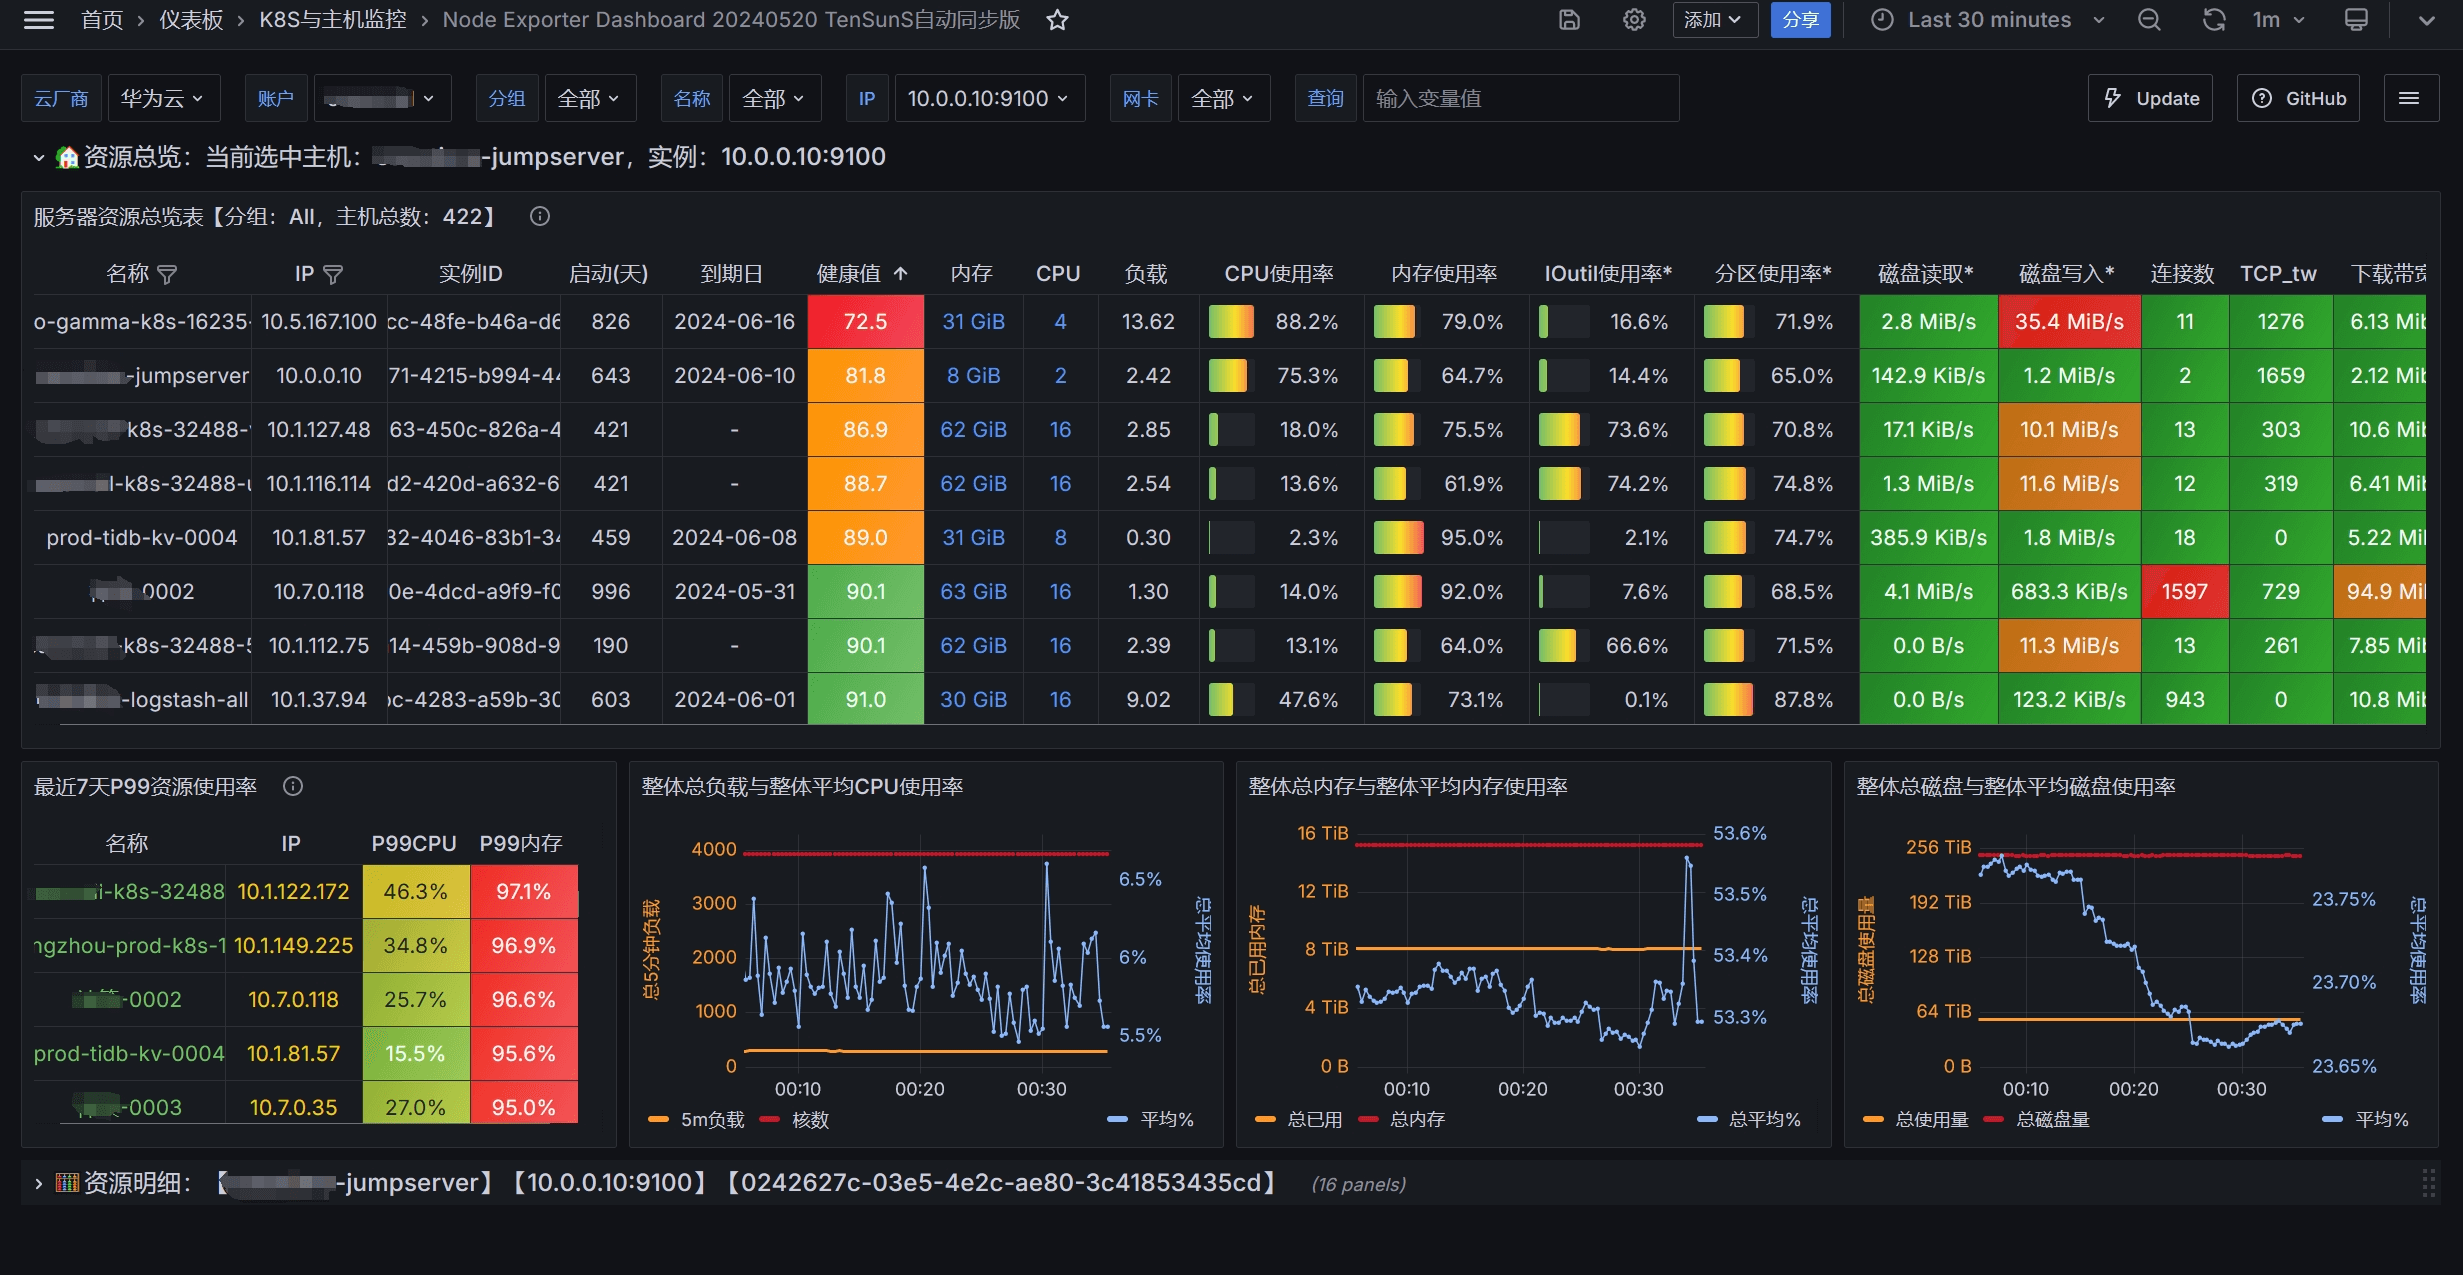
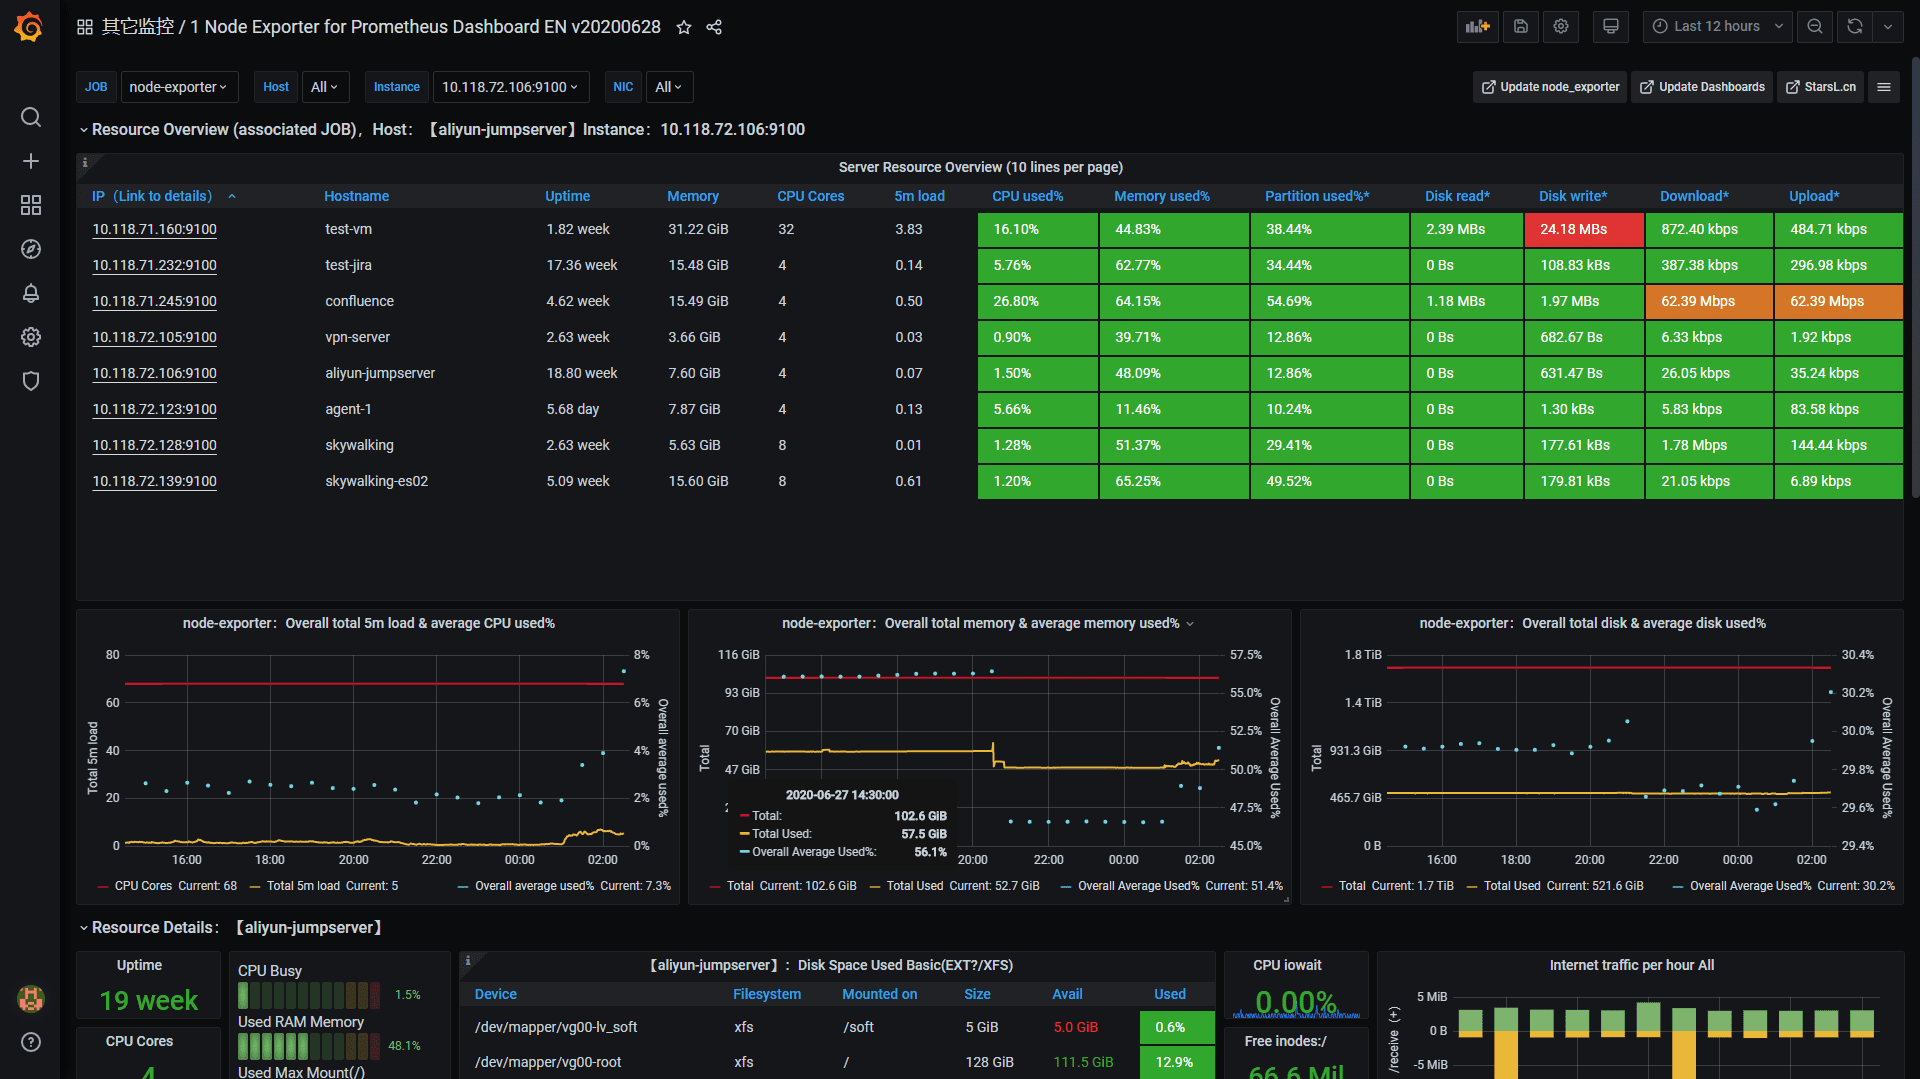
个人常用的几个模板:
https://grafana.com/grafana/dashboards/8919-node-exporter-dashboard-20240520-tensuns/
https://grafana.com/grafana/dashboards/1860-node-exporter-full/
https://grafana.com/grafana/dashboards/11074-node-exporter-for-prometheus-dashboard-en-v20201010/

 浙公网安备 33010602011771号