echarts 柱状图+折线+文字倾斜及省略
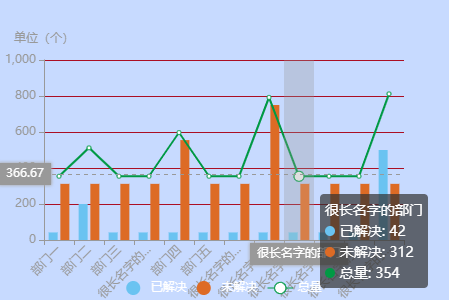
效果图:


代码:

  1 <!DOCTYPE html>
  2 <html lang="en">
  3 <head>
  4     <meta charset="UTF-8">
  5     <title>柱状图、折线图</title>
  6     <script src="js/jquery-2.2.3.min.js"></script>
  7     <script src="./js/echarts.min.js"></script>
  8 </head>
  9 <body>
 10     <!-- 为 ECharts 准备一个具备大小(宽高)的 DOM -->
 11     <div id="demo" style="width: 450px;height: 300px"></div>
 12 </body>
 13 <script>
 14     /*
 15     * 知识点:
 16     * 1、各个线条颜色设置
 17     * 2、X轴 坐标文字过长 倾斜、拼接省略号显示
 18     * 3、异步插入图表数据
 19     * */
 20 
 21     //初始化一个 echarts 实例
 22     var chart = echarts.init(document.getElementById('demo'));
 23     //指定图表的配置项和数据
 24     var option = {
 25         backgroundColor: 'rgba(70, 131, 254, .3)',//设置背景色
 26         tooltip: {//提示框组件
 27             trigger: 'axis',
 28             axisPointer: {
 29                 type: 'cross',
 30                 crossStyle: {
 31                     color: '#999'
 32                 }
 33             }
 34         },
 35         legend: {//图例组件
 36             data:[{name:'已解决',icon:'circle'},{name:'未解决',icon:'circle'},{name:'总量'}],
 37             textStyle:{
 38                 color:'#ffffff',
 39                 fontSize:12
 40             },
 41             y: 'bottom',
 42             x: 'center' ,
 43         },
 44         xAxis: [//直角坐标系 grid 中的 x 轴
 45             {
 46                 type: 'category',
 47                 axisLine:{
 48                     lineStyle:{
 49                         color:'#999999',//设置X轴颜色
 50                         width:1
 51                     }
 52                 },
 53                 data: [],//数据留待异步插入
 54                 axisPointer: {
 55                     type: 'shadow'
 56                 },
 57                 axisLabel:{
 58                     interval:0,//横轴信息全部显示
 59                     rotate:45,//度角倾斜显示
 60                     formatter:function(value){//只显示五个字 其余省略号
 61                         return value.length > 5?value.substring(0,5)+'...':value;
 62                     }
 63                 }
 64             }
 65         ],
 66         yAxis: [//直角坐标系 grid 中的 y 轴
 67             {
 68                 type: 'value',
 69                 splitLine:{
 70                     show:true  ,
 71                     lineStyle:{
 72                         color:'#ab0e23',//设置Y轴  分隔线 颜色
 73                         width: 1
 74                     }
 75                 },
 76                 axisLine:{
 77                     lineStyle:{
 78                         color:'#999999',//设置Y轴颜色
 79                         width:1
 80                     }
 81                 },
 82                 name: '单位(个)',
 83 //                min: 0,//Y坐标最小值
 84 //                max: 1000,Y坐标最大值
 85 //                interval: 50,//坐标间隔
 86             }
 87         ],
 88         series : [
 89             {
 90                 name:'已解决',
 91                 barWidth: '30%',
 92                 type:'bar',//柱状/条形图
 93                 itemStyle : {
 94                         color: '#6AC3F1'
 95                 },
 96                 data:[]//数据留待异步插入
 97             },
 98             {
 99                 name:'未解决',
100                 barWidth: '30%',
101                 type:'bar',//柱状/条形图
102                 itemStyle : {
103                         color: '#DD6B25'
104                 },
105                 data:[]//数据留待异步插入
106             },
107             {
108                 name:'总量',
109                 type:'line',//折线图
110                 itemStyle : {
111                         color: '#009944'
112                 },
113                 yAxisIndex: 0,
114                 data:[]//数据留待异步插入
115             }
116         ],
117     };
118 
119     //使用刚指定的配置项和数据显示图表。
120     chart.setOption(option);
121     //异步插入图表数据
122     getChartData(chart) ;
123 
124 
125     //获取图表数据并插入
126     function getChartData() {
127 //        $.ajax({
128 //            url: '/api/...',
129 //            data: {},
130 //            type: "POST",
131 //            dataType: 'json',
132 //            success: function(result){
133                 var result = {
134                     meg:'处理成功',
135                     req:true,
136                     rows:[
137                         {
138                             name: "部门一",
139                             notSolveCount: 312,
140                             solveCount: 42,
141                         },
142                         {
143                             name: "部门二",
144                             notSolveCount: 312,
145                             solveCount: 200,
146                         },
147                         {
148                             name: "部门三",
149                             notSolveCount: 312,
150                             solveCount: 42,
151                         },
152                         {
153                             name: "很长名字的部门",
154                             notSolveCount: 312,
155                             solveCount: 42,
156                         },                        {
157                             name: "部门四",
158                             notSolveCount: 555,
159                             solveCount: 42,
160                         },                        {
161                             name: "部门五",
162                             notSolveCount: 312,
163                             solveCount: 42,
164                         },                        {
165                             name: "很长名字的部门",
166                             notSolveCount: 312,
167                             solveCount: 42,
168                         },                        {
169                             name: "很长名字的部门",
170                             notSolveCount: 750,
171                             solveCount: 42,
172                         },
173                         {
174                             name: "很长名字的部门",
175                             notSolveCount: 312,
176                             solveCount: 42,
177                         },
178                         {
179                             name: "很长名字的部门",
180                             notSolveCount: 312,
181                             solveCount: 42,
182                         },
183                         {
184                             name: "很长名字的部门",
185                             notSolveCount: 312,
186                             solveCount: 42,
187                         },
188                         {
189                             name: "很长名字的部门",
190                             notSolveCount: 312,
191                             solveCount: 500,
192                         },
193                     ]
194                 }
195                 var _name = [], _resolved = [] , _unsolved = [] , _gross = [];
196                 if (result.rows.length > 0) {
197                     $.each(result.rows,function (i,v) {
198                         _name.push(v.name);
199                         _resolved.push(v.solveCount);
200                         _unsolved.push(v.notSolveCount);
201                         _gross.push(v.notSolveCount + v.solveCount);
202                     });
203                     //像图表中插入数据
204                     chart.setOption({
205                         series : [
206                             {
207                                 data:_resolved
208                             },
209                             {
210                                 data:_unsolved
211                             },
212                             {
213                                 data:_gross
214                             }
215                         ],
216                         xAxis : [
217                             {
218                                 data:_name
219                             }
220                         ]
221                     });
222                 }
223 //            }
224 //        });
225     }
226 </script>
227 </html>


posted @ 2019-06-21 08:47  &执念  阅读(4073)  评论(0编辑  收藏  举报