MySQL IO分析之-pt-ioprofile
一、安装介绍
pt-ioprofile工具是Percona-toolkit工具包中用来分析MySQL各个文件IO活动的小工具,pt-ioprofile工具需要用root用户执行且依赖于lsof和strace命令,该工具的基本逻辑如下
- 使用
lsof和strace采集数据- 汇聚采集的结果,汇聚规则可以是sum或avg
1.1 软件安装
## 先安装依赖包
shell> yum install lsof strace -y

## 下载并安装percona-toolkit
shell> wget https://www.percona.com/downloads/percona-toolkit/3.1.0/binary/redhat/7/x86_64/percona-toolkit-3.1.0-2.el7.x86_64.rpm

shell> yum install -y percona-toolkit-3.1.0-2.el7.x86_64.rpm
shell> pt-ioprofile --version
因strace在CentOS6和CentOS7上输出的头信息格式变化,导致该工具在CentOS7下目前存在BUG需要修改脚本,详细BUG信息可查看以下链接
## 修改脚本中574行对strace的匹配语法
shell> vim /usr/bin/pt-ioprofile +573
## 修改前
573    /^COMMAND/ { mode = "lsof";   }
574    /^Process/ { mode = "strace"; }

## 修改后
573    /^COMMAND/ { mode = "lsof";   }
574    /^(strace: )?Process/ { mode = "strace"; }
1.2 参数说明
--aggregate
- 数据汇聚方式,默认为sum,支持sum|avg两种
--cell
- 统计方式,默认为times(时间消耗),支持times|count|sizes
- count Count of I/O operations
- sizes Sizes of I/O operations
- times I/O operation timing
--group-by
- 数据分组方式,默认用filename,支持all|filename|pid
- all Summarize into a single line of output
- filename One line of output per filename
- pid One line of output per process ID
--profile-pid
- MySQL数据库的pid
--profile-process
- MySQL数据库的进程名称,通过进程名称解析pid
--run-time
- 数据采集运行时间,默认为30秒
--save-samples
- 将采集的数据保存到文件中
二、使用示例
2.1 MySQL 一次 insert 刷几次盘分析
## 确认当前MySQL的参数配置
mysql> select @@log_bin,@@sync_binlog,@@innodb_flush_log_at_trx_commit;
+-----------+---------------+----------------------------------+
| @@log_bin | @@sync_binlog | @@innodb_flush_log_at_trx_commit |
+-----------+---------------+----------------------------------+
| 1 | 1 | 1 |
+-----------+---------------+----------------------------------+
## 开启pt-ioprofile监控IO
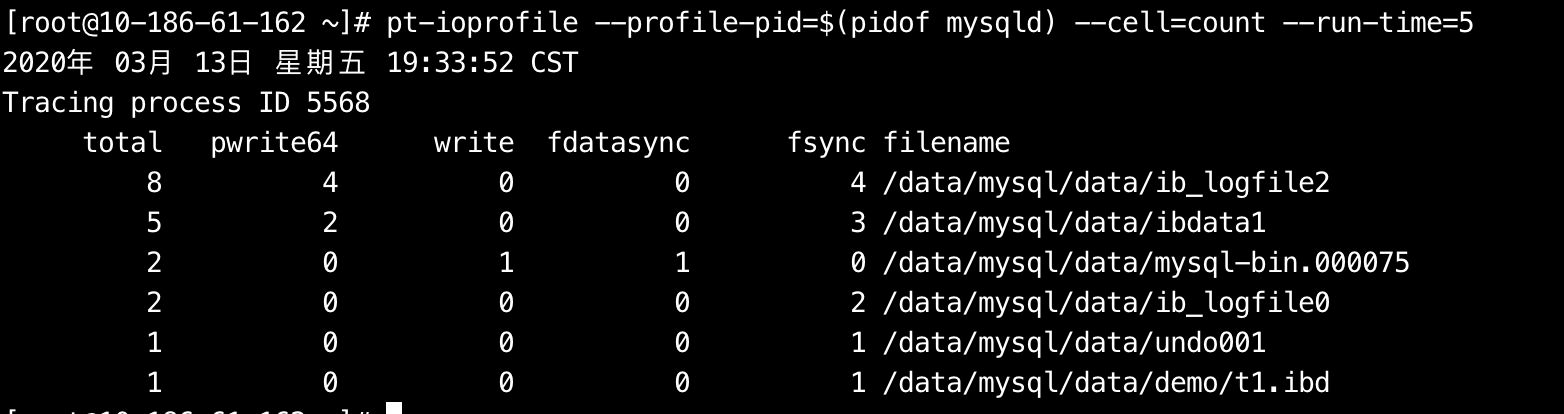
shell> pt-ioprofile --profile-pid=$(pidof mysqld) --cell=count --run-time=5
## 插入一条数据
mysql> insert into t1(uname) values('zhenxing') /* yuzhenxing */;

结果分析
- 对redolog使用的fsync方式刷盘,且redolog是持续刷盘的,所以可以看到在采集数据的几秒内刷了多次盘
- 对binlog使用的是fdatasync方式刷盘,且binlog只在事务提交时刷盘,也就值触发了一次刷盘操作
- 因为是insert操作,所以涉及undolog的生成,对undo也触发了一次fsync
- 对t1.ibd的数据做修改最终也触发了一次fsync
2.1.1 sync、fsync与fdatasync的区别
通过下图我们可以知道binlog采用的是fdatasync方式刷盘,而redo采用的是fsync方式,这两种方式有什么区别呢,以及图中未出现的sync方式
- sync
- sync函数只是将所有修改过的块缓冲区排入写队列,然后就返回,它并不等待实际写磁盘操作结束。
- fsync
- fsync函数只对由文件描述符filedes指定的单一文件起作用,并且等待写磁盘操作结束,然后返回。
- fsync可用于数据库这样的应用程序,因为数据库需要确保将修改过的块立即写到磁盘上
- fdatasync
- fdatasync函数类似于fsync,但它只影响文件的数据部分。而除数据外,fsync还会同步更新文件的属性。
2.1.2 write与pwrite的区别(read与pread)
通过下图我们可以知道,对于redolog采用的是pwrite方式写,而对于binlog用的write方式写,那这2种方式有什么区别了,相似还有read与pread
在解释他们区别前我们需要了解另一个函数lseek,该函数的作用是用来重新定位文件读写的位移。

- read/write
- 从磁盘读取数据或将buf中数据写入磁盘
- pwrite
- 从缓冲区
buf到偏移量offset的文件描述符fd读取/写入计数字节,但文件偏移量未更改。 - 由于lseek和read调用之间,内核可能会临时挂起进程,所以pread/pwrite是把lseek和read/write的调用作为一个原子性操作
- 从缓冲区
2.2 sync_binlog和innodb_flush_log_at_trx_commit刷盘分析
通过对比sync_binlog和innodb_flush_log_at_trx_commit在不同配置下的刷盘对比
## 压测语句
sysbench /usr/local/share/sysbench/oltp_read_write.lua --db-ps-mode=disable --mysql-host=127.0.0.1 --mysql-port=3306 --mysql-user=sysbench --mysql-password=sysbench --mysql-db=sbtest --tables=1 --table-size=10000000 --report-interval=1 --time=600 --threads=4 run
## 根据不同场景调整sync_binlog和innodb_flush_log_at_trx_commit值
set global sync_binlog=1;
set global innodb_flush_log_at_trx_commit=1;
select @@log_bin,@@sync_binlog,@@innodb_flush_log_at_trx_commit;
## IO监控命令
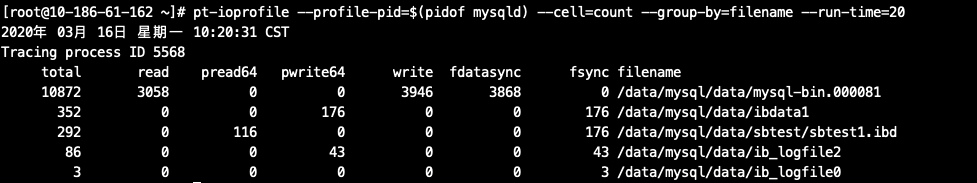
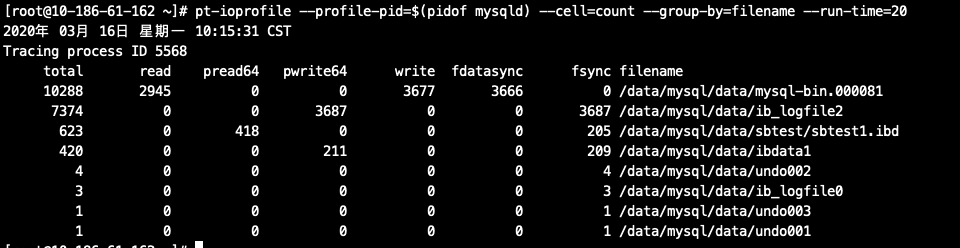
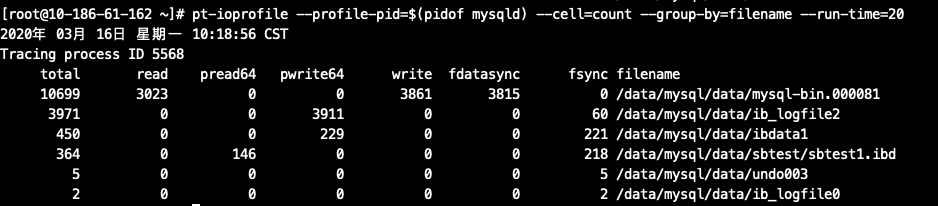
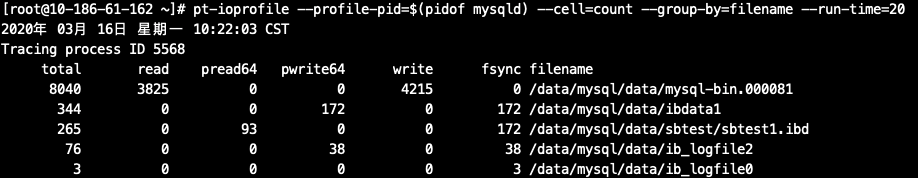
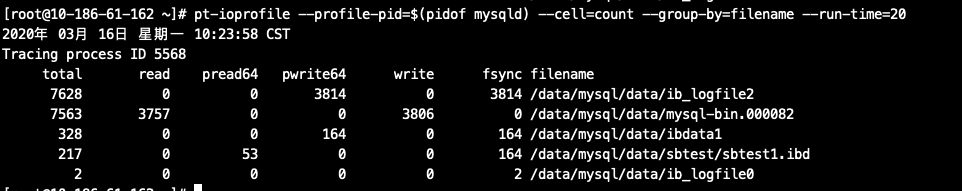
pt-ioprofile --profile-pid=$(pidof mysqld) --cell=count --group-by=filename --run-time=20
测试结果汇总
sync_binlog |
innodb_xxx_commit |
fdatasync | fsync | pwrite64 | write | read | total |
|---|---|---|---|---|---|---|---|
| 1 | 0 | 3868 | 46 | 43 | 3946 | 3058 | |
1 |
1 |
3666 |
3687 |
3687 |
3677 |
2945 |
最安全也最耗性能 |
| 1 | 2 | 3815 | 62 | 3911 | 3861 | 3023 | |
0 |
0 |
NULL |
41 |
38 |
4215 |
3825 |
最不安全也最不耗性能 |
| 0 | 1 | NULL | 3814 | 3814 | 3806 | 3757 | |
| 0 | 2 | NULL | 68 | 4032 | 3978 | 3827 |
测试结果分析
- 在sync_binlog和innodb_flush_log_at_trx_commit都设置为0时刷盘频率最低,对IO影响最小
- 在sync_binlog和innodb_flush_log_at_trx_commit都设置为1是刷盘频率最高,每个事务都需要刷盘操作,性能影响最大
- 在sync_binlog设置为0时,并不会触发fdatasync操作
- 测试也可以侧面说明当磁盘IO压力较大时,将sync_binlog和innodb_flush_log_at_trx_commit设置为0确实可以明显提升数据库性能
三、pt-ioprofile限制
pt-ioprofile会冻结服务器,并可能使进程崩溃,或在分离后使其性能下降,或使其处于睡眠状态,pt-ioprofile是一种侵入性工具,不应在生产服务器上使用pt-ioprofile。
四、参考文档
- https://www.percona.com/doc/percona-toolkit/LATEST/pt-ioprofile.html
- https://jira.percona.com/browse/PT-1631
- https://github.com/percona/percona-toolkit/blob/3.0.12/bin/pt-ioprofile#L574
五、附录
1. 测试结果图表
sync_binlog=1 && innodb_flush_log_at_trx_commit=0
sync_binlog=1 && innodb_flush_log_at_trx_commit=1
sync_binlog=1 && innodb_flush_log_at_trx_commit=2
sync_binlog=0 && innodb_flush_log_at_trx_commit=0
sync_binlog=0 && innodb_flush_log_at_trx_commit=1
sync_binlog=0 && innodb_flush_log_at_trx_commit=2


 浙公网安备 33010602011771号