java.lang.OutOfMemoryError: GC overhead limit exceeded
1 背景
公司的一个项目,平时运行一直没问题,但是最近,时不时的会报出 java.lang.OutOfMemoryError: GC overhead limit exceeded 错误,然后,java进程就处于假死状态,几天都不会有后台日志更新。
2 问题原因
可以明确的一点是,jvm出现了问题。所以,查看jvm内存使用情况

可以看出,FGC进行了89次,而YGC是23次。这就有点奇怪了,为什么fullGC这么频繁,而且还超过了yangGC次数。所以可以肯定的是和FullGC过于频繁有关。
默认情况下,如果在某一个时间段内,FullGC花费的时间超过 98%,并且GC 回收的内存少于 2%,JVM 就会抛出这个错误。而且抛出这个错误后,jvm将不再进行GC动作,jvm将处于假死状态。
那什么导致的FullGC频繁呢?我们注意到,OldCapacity=2.7G。而当JVM刚启动的时候,默认分配的堆内存为物理内存的1/64,本机内存15G,也就是说会分配230M内存给jvm堆,而老年代默认占8/10堆内存,也就是不到200M,但是现在这个内存是2.7G,很明显是因为某一个业务把大量数据放到内存中,导致老年代堆内存一直在增大导致的,在这个过程中,老年代内存一直无法容纳这么大的数据量,一直进行FullGC,最终在短时间内FullGC过于频繁,最终触发了GC overhead limit exceeded。
为了验证我们的猜想,我们查看业务日志,发现在出现GC overhead limit exceeded之前,某一个用户在查询venn图。
2022.09.07 17:35:23.920 INFO  [http-nio-8081-exec-6] com.xxx.xxx.microbereport.controller.module.VennController 38 venn - RequestBody:{"planCode":"xxx","customerEmail":"xxx","currentCompareGroup":""}
2022.09.07 17:39:04.329 WARN  [HikariPool-1 housekeeper] com.zaxxer.hikari.pool.HikariPool$HouseKeeper 766 run - HikariPool-1 - Thread starvation or clock leap detected (housekeeper delta=1m3s213ms343µs686ns).
2022.09.07 17:41:21.004 ERROR [org.springframework.kafka.KafkaListenerEndpointContainer#0-1-C-1] org.springframework.kafka.listener.KafkaMessageListenerContainer$ListenerConsumer 718 run - Stopping container due to an Error java.lang.OutOfMemoryError: GC overhead limit exceeded
2022.09.07 17:41:20.999 WARN  [cluster-ClusterId{value='63186157d456c1530516ee32', description='null'}-16s3:27017] com.mongodb.diagnostics.logging.SLF4JLogger 91 warn - Exception in monitor thread during notification of server description state change java.lang.OutOfMemoryError: GC overhead limit exceeded
2022.09.07 17:40:37.030 ERROR [ThreadPoolTaskScheduler-1] org.springframework.scheduling.support.TaskUtils$LoggingErrorHandler 96 handleError - Unexpected error occurred in scheduled task. java.lang.OutOfMemoryError: GC overhead limit exceeded
而这个查询会查询整个otu表格,可能这个otu表格特别大(比如2.7G,具体大小待验证)
为了复现这个问题,使用这个账号登陆,然后做同样的查询,可以很清楚的看到,刚开始的时候,FGC=3,OC=240M

经过这个比较耗时耗内存的查询后,结果为FGC=89,OC=2700M

至此,问题根因找到了,就是这个查询导致的。
总结:这个问题出现的原因是在某一个时间段内,某处代码把大量数据放到内存中,导致jvm堆内存不足,发生FullGC动作以便进行垃圾回收和增大jvm内存。但是在该段极短的时间内,FullGC次数达到阈值,触发了GC overhead limit exceeded。
找到根因,解决方法也就有了,由于还未着手修改代码,所以这篇文章到此为止,后面根据情况进行补充后续内容。
后记:
后来,对代码进行了修改。对这种类型的查询进行预处理,因为查询所有数据到内存装不下,想了个办法,每次查询5000条数据,然后对冗余项进行瘦身,然后再存储到一个新的集合中。页面查询时使用经过瘦身的数据。
3 后续的观察
隔了一段时间,再次观察java进程内存使用情况,发现,FGC次数还是很高,但是没有发生过上述提到的 java.lang.OutOfMemoryError: GC overhead limit exceeded ,

FGC发生了604次,怀疑是否还是存在内存泄漏
于是,使用jmap命令导出堆内存
jmap -J-d64 -dump:live,format=b,file=heap_dump.16s1 13355

使用MemoryAnalyzer分析工具进行分析
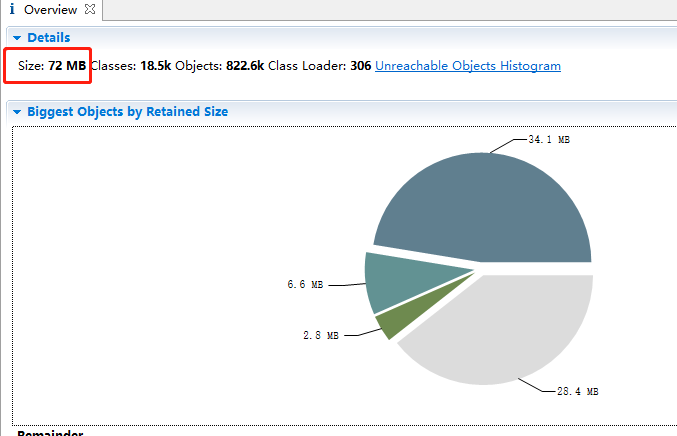
但是,让我奇怪的是这里的内存显式是72M。导出之前使用jstat查看明明是至少1.2G
后来发现,我们运行了jmap后,FGC次数增加了一次,这就明白了,当我们执行jmap时,执行了一次FGC

可以看到,老年代使用内存从1.2G变为了77M,也就是我们在上图我们看到的72M(不完全一致,因为堆内存一直在变化)
经过我们的分析,没有内存泄漏。FGC次数多的原因是jvm启动前期分配的内存比较小,而我们系统查询又涉及到大对象的查询,前期FGC次数增长比较快。
经过页面上几次点击查询之后,我们再观察一下堆内存变化,可以看到,堆内存又上来了

后续的再次处理
上次修改代码时,我么的做法是,在用户页面首次点击查询时,首先对数据进行瘦身。后续查询经过瘦身的数据。但是有一个问题,就是,如果数据量特别大,查询可能要花费几十秒甚至几分钟。如果用户多次点击,将会多次触发数据预处理过程。导致经过瘦身的数据集会有异常。因此,这里必须只对数据进行1次瘦身处理。
想到的方法是进行多线程同步。但是,我么的系统部署在3节点的集群上,用户点击查询会负载均衡到任何一个节点,因此,为了保证业务过程正确,要使用分布式锁解决这个问题,这里我们使用的是Redisson,代码如下:
    public List queryByOtuTable(String otuTable) {
        Query query = new Query();
        Criteria criteria = new Criteria();
        criteria.and("otu_table").is(otuTable);
        criteria.and("status").is(1);
        query.addCriteria(criteria);
        query.fields().exclude("_id");
        List<Map> vennResults = mongoTemplate.find(query, Map.class, MongoConstants.XXX_OTU_TABLE_FOR_VENN);
        if(null == vennResults)
        {
            LOGGER.error("查询失败,vennResults==null");
            return null;
        }
        //因为xxx_otu_table过于庞大和冗余,如果表格过于庞大,会把java服务搞崩,这里进行二次处理,处理后的结果放到xxx_otu_table_for_venn中
        if(vennResults.size() == 0)
        {
            LOGGER.info("查询xxx_otu_table_for_venn为空,首先作数据处理,处理完之后再进行查询");
            executor.submit(() -> {
                handleOtu(otuTable);
            });
        }
        return vennResults;
    }
对otu表格进行预处理的代码
//需要加分布式事务,不然,多个线程进来的话,会有问题
    private void handleOtu(String otuTable) {
        RLock lock = redisson.getLock(otuTable);
        try
        {
            lock.lock(30, TimeUnit.MINUTES);//超时时间为30分钟
            //因为页面点击多次的话,虽然加了同步机制,但是这个方法终究会执行多次,所以刚开始要先查询一下xxx_otu_table_for_venn,如果状态是1,则表示已经有线程进行了处理,直接返回
            if(exist(otuTable))
            {
                LOGGER.info("数据已经被其他线程处理过,这里不做处理,直接返回:{}", otuTable);
                return;
            }
            //1 首先查询文档数
            long total = count(otuTable);
            LOGGER.info("otu表格大小:{}", total);
            long curr = 0;

            Query query = new Query();
            Criteria criteria = new Criteria();
            criteria.and("otu_table").is(otuTable);
            query.addCriteria(criteria);
            query.fields().exclude("_id");
            query.fields().exclude("report_name");
            query.fields().exclude("sample_num");
            query.fields().exclude("otu_sequence");
            query.fields().exclude("update");

            //每次查询5000条数据
            while(true)
            {
                LOGGER.info("每次查询5000条,已处理:{}",curr);
                List<Map> resultList = mongoTemplate.find(
                        query.skip(curr).limit(5000).with(
                                new Sort(Sort.Direction.ASC, "_id")),
                        Map.class, MongoConstants.XXX_OTU_TABLE);
                if(resultList.size() == 0)
                {
                    LOGGER.info("查询列表为空");
                    break;
                }

                //数据过滤
//            略...
                //将数据写入新集合
                mongoTemplate.insert(resultList, MongoConstants.XXX_OTU_TABLE_FOR_VENN);


                if(resultList.size() < 5000)
                {
                    LOGGER.info("查询列表小于5000,最后一次循环");
                    break;
                }
                curr = curr + 5000;
            }
            Query query_update = new Query(Criteria.where("otu_table").is(otuTable));
            Update update = new Update();
            update.set("status", 1);
//处理完,把状态置为1,表示这个数据集可用
            mongoTemplate.updateMulti(query_update, update, MongoConstants.XXX_OTU_TABLE_FOR_VENN);
        }
        finally {
            lock.unlock();
        }

    }
我们使用postman Runner进行接口调用,模拟压力测试场景,同时触发5次调用
后代打印的日志
2022.09.23 10:35:39.730 INFO  [http-nio-8081-exec-8] xxx.controller.module.VennController 38 venn - RequestBody:{"planCode":"uv5Mqn7","customerEmail":"xxx","currentCompareGroup":""}
2022.09.23 10:35:39.741 INFO  [http-nio-8081-exec-8] xxx.service.module.impl.VennServiceImpl 75 queryByOtuTable - 查询xxx_otu_table_for_venn为空,首先作数据处理,处理完之后再进行查询
2022.09.23 10:35:39.741 ERROR [http-nio-8081-exec-8] xxx.controller.module.VennController 109 venn - 根据分析号uv5Mqn7查询otu数据,列表长度为空
...
以上信息总共在不同的线程中打印5次,因为postman中调用了5次
...
2022.09.23 10:35:42.493 INFO  [defaultThreadPool_5] xxx.service.module.impl.VennServiceImpl 100 handleOtu - otu表格大小:25868
2022.09.23 10:35:42.494 INFO  [defaultThreadPool_5] xxx.service.module.impl.VennServiceImpl 116 handleOtu - 每次查询5000条,已处理:0
2022.09.23 10:35:49.301 INFO  [defaultThreadPool_5] xxx.service.module.impl.VennServiceImpl 116 handleOtu - 每次查询5000条,已处理:5000
2022.09.23 10:35:57.146 INFO  [defaultThreadPool_5] xxx.service.module.impl.VennServiceImpl 116 handleOtu - 每次查询5000条,已处理:10000
2022.09.23 10:36:01.840 INFO  [defaultThreadPool_5] xxx.service.module.impl.VennServiceImpl 116 handleOtu - 每次查询5000条,已处理:15000
2022.09.23 10:36:06.246 INFO  [defaultThreadPool_5] xxx.service.module.impl.VennServiceImpl 116 handleOtu - 每次查询5000条,已处理:20000
2022.09.23 10:36:10.756 INFO  [defaultThreadPool_5] xxx.service.module.impl.VennServiceImpl 116 handleOtu - 每次查询5000条,已处理:25000
2022.09.23 10:36:11.359 INFO  [defaultThreadPool_5] xxx.service.module.impl.VennServiceImpl 149 handleOtu - 查询列表小于5000,最后一次循环
2022.09.23 10:36:11.932 INFO  [defaultThreadPool_7] xxx.service.module.impl.VennServiceImpl 95 handleOtu - 数据已经被其他线程处理过,这里不做处理,直接返回:uv5Mqn7
2022.09.23 10:36:11.935 INFO  [defaultThreadPool_6] xxx.service.module.impl.VennServiceImpl 95 handleOtu - 数据已经被其他线程处理过,这里不做处理,直接返回:uv5Mqn7
2022.09.23 10:36:11.939 INFO  [defaultThreadPool_8] xxx.service.module.impl.VennServiceImpl 95 handleOtu - 数据已经被其他线程处理过,这里不做处理,直接返回:uv5Mqn7
2022.09.23 10:36:11.953 INFO  [defaultThreadPool_9] xxx.service.module.impl.VennServiceImpl 95 handleOtu - 数据已经被其他线程处理过,这里不做处理,直接返回:uv5Mqn7
我们可以看到,这个查询耗时20秒,并且只有一个线程做了数据处理,后面4个线程没有对数据做处理,达到了分布式环境下多线程下线程安全的目的。
3 linux下如何使用Memory Analyzer
有专门的linux版本(下载时注意支持的jdk版本)
wget https://www.eclipse.org/downloads/download.php?file=/mat/1.5/rcp/MemoryAnalyzer-1.5.0.20150527-linux.gtk.x86_64.zip
解压
upzip MemoryAnalyzer-1.5.0.20150527-linux.gtk.x86_64.zip
修改配置
解压后生成mat目录,修改./mat/ParseHeapDump.sh,添加参数-vmargs -Xmx8g -XX:-UseGCOverheadLimit
./MemoryAnalyzer -consolelog -application org.eclipse.mat.api.parse "$@" -vmargs -Xmx8g -XX:-UseGCOverheadLimit
开始生成分析报告
root 16:07:33 /nas1/szj_temp/mat
$ ./ParseHeapDump.sh ../heap_dump20240312.16s1 org.eclipse.mat.api:suspects
会生成heap_dump20240312_Leak_Suspects.zip文件,把文件拷贝到windows上进行查看
4 jvm使cpu使用率达到400%的问题定位
还是上面查询venn图的问题。
背景:一段时间以来发现服务常常cpu占用了达到了400%,且持续一段时间后,FullGC频繁,服务假死。
首先,按照前面相同的方式导出堆内存,发现还是venn查询这一块出问题了
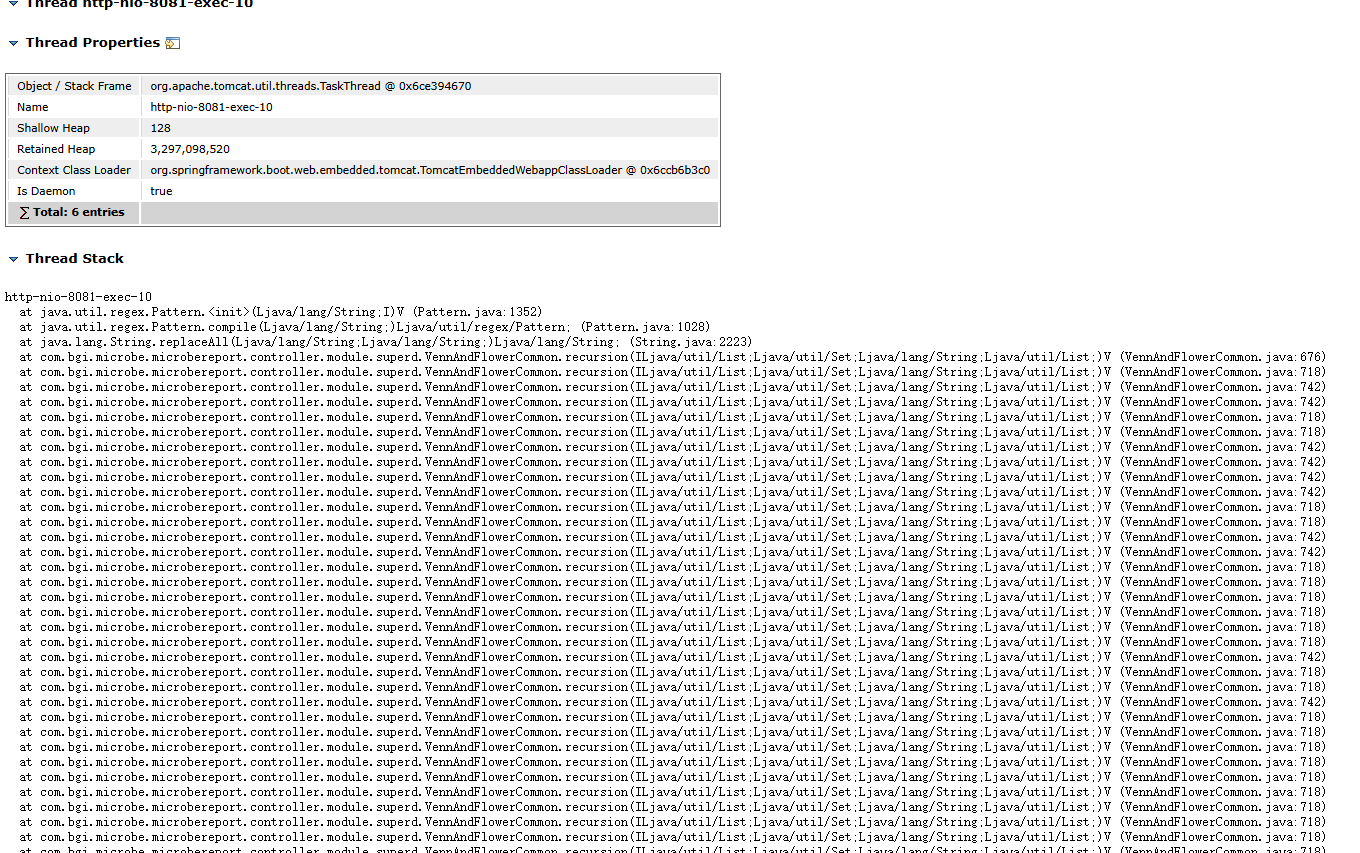
其占用内存3.1G
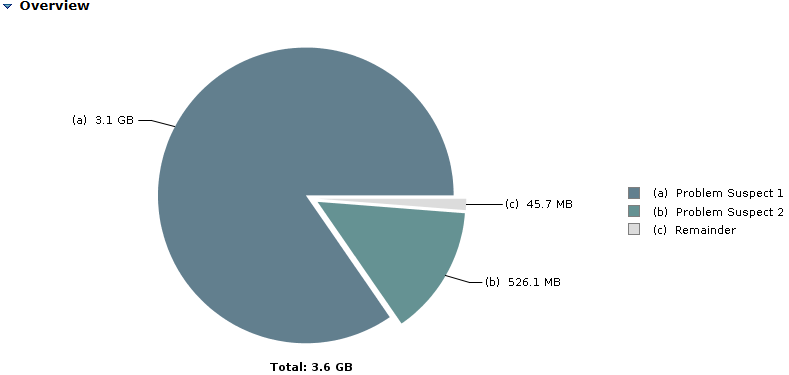
然后,使用jstack查看java进程堆栈快照(每个线程对应一个堆栈调用)
"http-nio-8081-exec-5" #64 daemon prio=5 os_prio=0 tid=0x00007ff054cdf000 nid=0x2999 runnable [0x00007fefa50e1000]
   java.lang.Thread.State: RUNNABLE
        at java.util.regex.Pattern.atom(Pattern.java:2240)
        at java.util.regex.Pattern.sequence(Pattern.java:2144)
        at java.util.regex.Pattern.expr(Pattern.java:2010)
        at java.util.regex.Pattern.compile(Pattern.java:1702)
        at java.util.regex.Pattern.<init>(Pattern.java:1352)
        at java.util.regex.Pattern.compile(Pattern.java:1028)
        at java.lang.String.replaceAll(String.java:2223)
        at com.bgi.microbe.microbereport.controller.module.superd.VennAndFlowerCommon.recursion(VennAndFlowerCommon.java:675)
        at com.bgi.microbe.microbereport.controller.module.superd.VennAndFlowerCommon.recursion(VennAndFlowerCommon.java:718)
        at com.bgi.microbe.microbereport.controller.module.superd.VennAndFlowerCommon.recursion(VennAndFlowerCommon.java:718)
        at com.bgi.microbe.microbereport.controller.module.superd.VennAndFlowerCommon.recursion(VennAndFlowerCommon.java:742)
        at com.bgi.microbe.microbereport.controller.module.superd.VennAndFlowerCommon.recursion(VennAndFlowerCommon.java:742)
"http-nio-8081-exec-5" #64 daemon prio=5 os_prio=0 tid=0x00007ff054cdf000 nid=0x2999 runnable [0x00007fefa50e1000]
top -H -p 14978查看操作系统层面该进程下的各个线程资源使用情况,找到有问题的线程,方便我们定位问题
top -H -p 14978
我们看到这个进程下,有一个线程cpu使用率出奇的高。
首先,怀疑jvm堆栈大小设置的太小了,进行递归调用时,栈内存不足导致的,所以,加上-Xss5m参数将栈内存设置为5m(这个已经相当大了,设想每个线程如果都使用5M栈,这是不可想象的)。然而,不起作用。所以不是栈大小的问题。
因此怀疑,代码中某处有逻辑问题,因此,查看代码,结合页面上调用的接口,发现有一个接口调用超时,看了下,这个接口(/vennTable)没有校验比较组个数,要求比较组大于5个就不能作venn图,这里比较组个数是50个,将进行递归调用2^50-1次,这是个天文数字,因此我们看到CPU一直居高不下,就是在做递归调用。
问题找到,加上校验,功能正常了。
5 liunx下定位jvmCPU消耗达到100%的问题

该Java进程cpu消耗达到100%,且持续几十分钟,说明有一个cpu核心一直被这个Java进程占用
5.1 找出这个进程对应的所有线程

可以看到,19222这个线程占用了99.7%的cpu
jstack命令打印线程的实时堆栈信息,首先将线程号转为16进制方便jstack调用:printf "%x" 19222。然后使用jstack命令打印出线程堆栈信息

6 linux线程耗尽-java服务引发的
登录节点时,提示无法创建新的进程。

使用root登录且查看问题账号的线程数时发现线程数已经耗尽了。
$ ulimit -u # 用户进程数限制
4096
$ ps -u P_bc_qsub -L | wc -l # 特定用户已创建线程数
4097
然后查看java进程的堆栈信息,发现有大量的sshd-SshClient开头的线程,经过统计,这些线程在一个java进程中就有1500多个。
$ jstack 4577 | less
因此断定是SshClient使用不当引起的线程无法释放。
    public Map<String, Object> ssh(String cmd, String host, String user, String pw, boolean longTimeout) {
        Map<String, Object> resultMap = new HashMap<>();
        ClientSession session = null;
        boolean isCachedSession = false;

        try {
            session = SESSION_CACHE.get(host);

            // 2. 如果缓存没有或未启用缓存,则新建 Session
            if (session == null) {
                SshClient client = SshClient.setUpDefaultClient();
                client.start();
                ConnectFuture connectFuture = client.connect(user, host, 22);
                connectFuture.await();
                session = connectFuture.getSession();
                session.addPasswordIdentity(pw);
                session.auth().verify();
                LOGGER.info("新建 SSH 连接: host={}", host);

                // 如果启用缓存,存入 SESSION_CACHE
                if (longTimeout) {
                    LOCK.lock();
                    try {
                        SESSION_CACHE.put(host, session);
                    } finally {
                        LOCK.unlock();
                    }
                }
            }

            if (longTimeout) {
                isCachedSession = (session != null);
            }

            // 3. 执行命令
            ClientChannel channel = session.createChannel("exec", cmd);
            ByteArrayOutputStream output = new ByteArrayOutputStream();
            channel.setOut(output);
            channel.open().verify();
            channel.waitFor(EnumSet.of(ClientChannelEvent.CLOSED), TimeUnit.SECONDS.toMillis(60));

            Integer exitStatus = channel.getExitStatus();
            String result = new String(output.toByteArray(), StandardCharsets.UTF_8);

            if (exitStatus == null) {
                LOGGER.warn("exitStatus 为空");
                resultMap.put("statusCode", -1);
                resultMap.put("message", "无法获取执行退出码");
            } else {
                resultMap.put("message", result);
                resultMap.put("statusCode", exitStatus == 0 ? 1 : -1);
            }

            if(result.length()>5000) {
                LOGGER.info("Command output: {}", result.substring(0,4998)+"...");
            } else {
                LOGGER.info("Command output: {}", result);
            }

            LOGGER.info("Exit status: {}", exitStatus);

        } catch (Exception e) {
            LOGGER.error("SSH 命令执行异常", e);
            resultMap.put("statusCode", -1);
            resultMap.put("message", "调用脚本时抛出异常: " + e.getMessage());
            // 如果 Session 异常,移除缓存
            if (session != null && longTimeout) {
                LOCK.lock();
                try {
                    SESSION_CACHE.remove(host);
                } finally {
                    LOCK.unlock();
                }
            }
        } finally {
            // 如果未启用缓存,或者明确要求不复用,则关闭 Session
            if (!longTimeout || !isCachedSession) {
                if (session != null && session.isOpen()) {
                    try {
                        session.close();
                        LOGGER.info("关闭 SSH 连接: host={}", host);
                    } catch (IOException e) {
                        LOGGER.error("关闭 Session 失败", e);
                    }
                }
            }
        }

        return resultMap;
    }
有问题的部分是上面标红的部分,每次session过期后都会创建新的SshClient实例,经过了解,每创建一次,就会生成大约10个如下线程。因此java进程中的线程数会慢慢积累,最终导致了线程数耗尽
"sshd-SshClient[6440112d]-nio2-resume-thread-3" #196 daemon prio=5 os_prio=0 tid=0x00007f172c02e800 nid=0x714 waiting on condition [0x00007f1788a0d000]
"sshd-SshClient[6440112d]-nio2-resume-thread-2" #128 daemon prio=5 os_prio=0 tid=0x00007f1730012000 nid=0x59a3 waiting on condition [0x00007f17233f4000]
"sshd-SshClient[6440112d]-nio2-thread-9" #48 daemon prio=5 os_prio=0 tid=0x00007f172c0e8800 nid=0x178e waiting on condition [0x00007f17237f8000]
"sshd-SshClient[6440112d]-nio2-thread-8" #47 daemon prio=5 os_prio=0 tid=0x00007f1778010000 nid=0x178d waiting on condition [0x00007f17238f9000]
"sshd-SshClient[6440112d]-nio2-thread-7" #46 daemon prio=5 os_prio=0 tid=0x00007f177800e800 nid=0x178c waiting on condition [0x00007f17239fa000]
"sshd-SshClient[6440112d]-nio2-thread-6" #45 daemon prio=5 os_prio=0 tid=0x00007f177800c800 nid=0x178b waiting on condition [0x00007f1723afb000]
"sshd-SshClient[6440112d]-nio2-thread-5" #44 daemon prio=5 os_prio=0 tid=0x00007f177800b000 nid=0x178a waiting on condition [0x00007f1723bfc000]
"sshd-SshClient[6440112d]-nio2-thread-4" #43 daemon prio=5 os_prio=0 tid=0x00007f1778009800 nid=0x1789 waiting on condition [0x00007f1723efd000]
"sshd-SshClient[6440112d]-nio2-thread-3" #42 daemon prio=5 os_prio=0 tid=0x00007f17240c6800 nid=0x1788 waiting on condition [0x00007f1723ffe000]
"sshd-SshClient[6440112d]-nio2-thread-2" #41 daemon prio=5 os_prio=0 tid=0x00007f1724085800 nid=0x1787 waiting on condition [0x00007f1788108000]
"sshd-SshClient[6440112d]-nio2-thread-1" #40 daemon prio=5 os_prio=0 tid=0x00007f172407e800 nid=0x1786 waiting on condition [0x00007f1788209000]
"sshd-SshClient[6440112d]-nio2-resume-thread-1" #39 daemon prio=5 os_prio=0 tid=0x00007f172c03c000 nid=0x1785 waiting on condition [0x00007f178830a000]
"sshd-SshClient[6440112d]-timer-thread-1" #18 daemon prio=5 os_prio=0 tid=0x00007f1819a3d800 nid=0x120b waiting on condition [0x00007f178a51e000]
解决方式,将SshClient设置为单例,
@Service
public class CmdService {
    private static final ConcurrentHashMap<String, ClientSession> SESSION_CACHE = new ConcurrentHashMap<>();
    private static final ReentrantLock LOCK = new ReentrantLock();

    private static final SshClient SSH_CLIENT;

    static {
        SSH_CLIENT = SshClient.setUpDefaultClient();
        SSH_CLIENT.start();
        LOGGER.info("单例SshClient 已启动");
    }
...
    public Map<String, Object> ssh(String cmd, String host, String user, String pw, boolean longTimeout) {
        Map<String, Object> resultMap = new HashMap<>();
        ClientSession session = null;
        boolean isCachedSession = false;

        try {
            session = SESSION_CACHE.get(host);

            // 2. 如果缓存没有或未启用缓存,则新建 Session
            if (session == null) {
                ConnectFuture connectFuture = SSH_CLIENT.connect(user, host, 22);
                connectFuture.await();
                session = connectFuture.getSession();
                session.addPasswordIdentity(pw);
                session.auth().verify();
                LOGGER.info("新建 SSH 连接: host={}", host);
...

 浙公网安备 33010602011771号