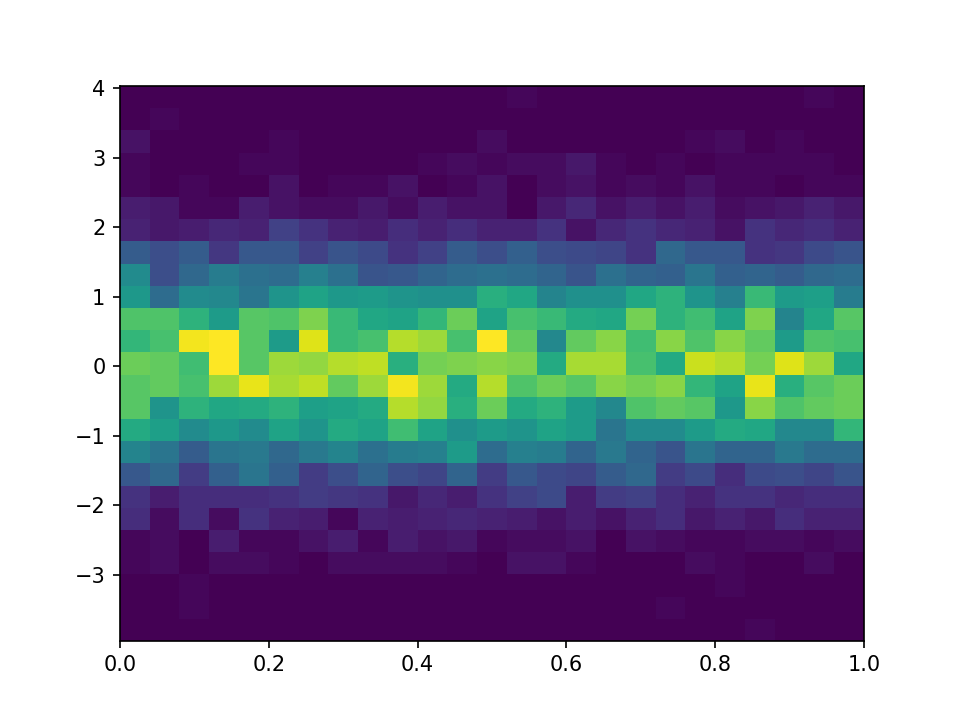
1 plt.figure()
2
3 Y = np.random.normal(loc=0.0, scale=1.0, size=10000)
4 X = np.random.random(size=10000)
 #bins设置区间大小
5 _ = plt.hist2d(X, Y, bins=25)
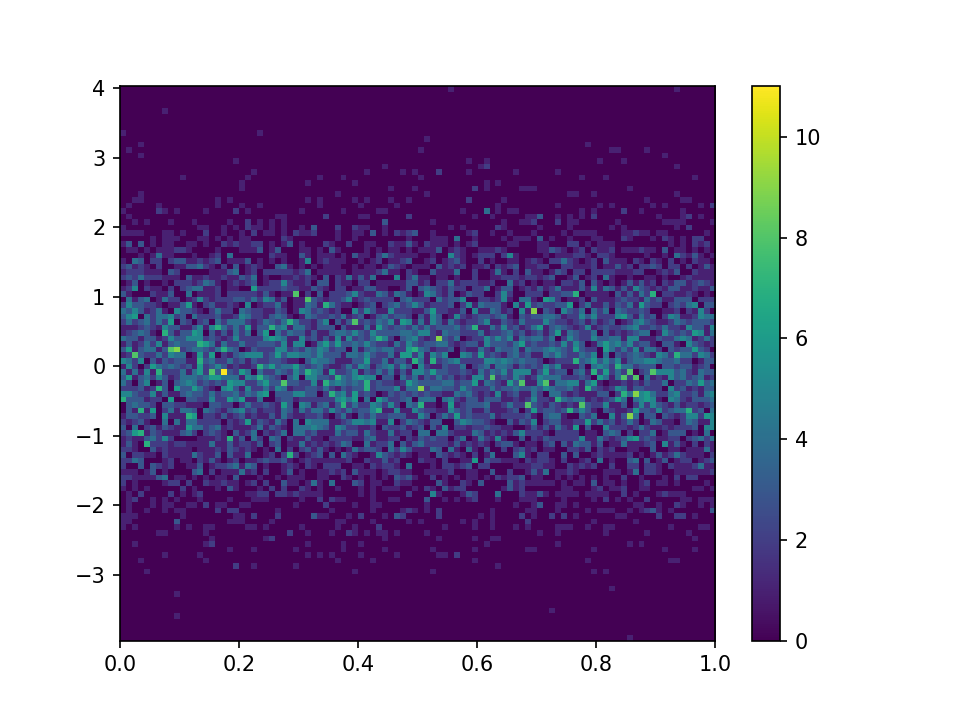
1 plt.figure()
2 _ = plt.hist2d(X, Y, bins=100)
3
4 # 加上颜色的标注
5 plt.colorbar()


 浙公网安备 33010602011771号