
Python之matplotlib绘图
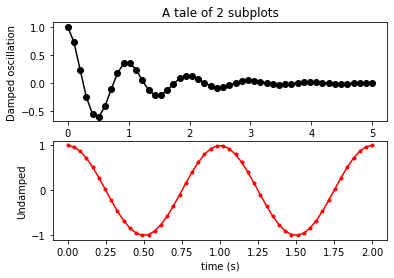
import numpy as np
import matplotlib.pyplot as plt

x1 = np.linspace(0.0, 5.0)
x2 = np.linspace(0.0, 2.0)
y1 = np.cos(2 * np.pi * x1) * np.exp(-x1)
y2 = np.cos(2 * np.pi * x2)
# 两行1列,第一行
plt.subplot(2, 1, 1)
plt.plot(x1, y1, 'ko-')
plt.title('A tale of 2 subplots')
plt.ylabel('Damped oscillation')
# 两行1列,第二行
plt.subplot(2, 1, 2)
plt.plot(x2, y2, 'r.-')
plt.xlabel('time (s)')
plt.ylabel('Undamped')

plt.show()

 浙公网安备 33010602011771号