
用python plt.subplots画色块图
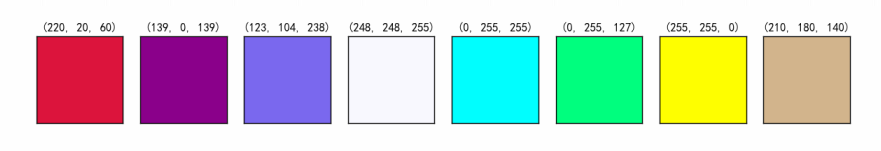
from PIL import Image
import matplotlib.pyplot as plt

color_map = [(220, 20, 60), (139, 0, 139), (123, 104, 238), (248, 248, 255),
                         (0, 255, 255), (0, 255, 127), (255, 255, 0), (210, 180, 140)]

# 1行8子图
fig, axs = plt.subplots(1, len(color_map), figsize=(15, 15))
for i, color in enumerate(color_map):
    img = Image.new('RGB', (10, 10), color)
    ax = axs[i]
    ax.set_title(color)
  # 去掉刻度
    ax.set_xticks([])
    ax.set_yticks([])
  # 去掉坐标轴
  # ax.axis('off')
    ax.imshow(img)

plt.savefig(r'E:\colormap.png')
plt.show()
输出:

 浙公网安备 33010602011771号