
echarts学习之----多图例折线图
直接上代码:
<template>
<div id="chart-test1" :style="{ height: '500px',width:'1000px'}"></div>
</template>
<script>
export default {
data() {
return {
testOption1: {
backgroundColor: '', //设置背景色透明
legend: {
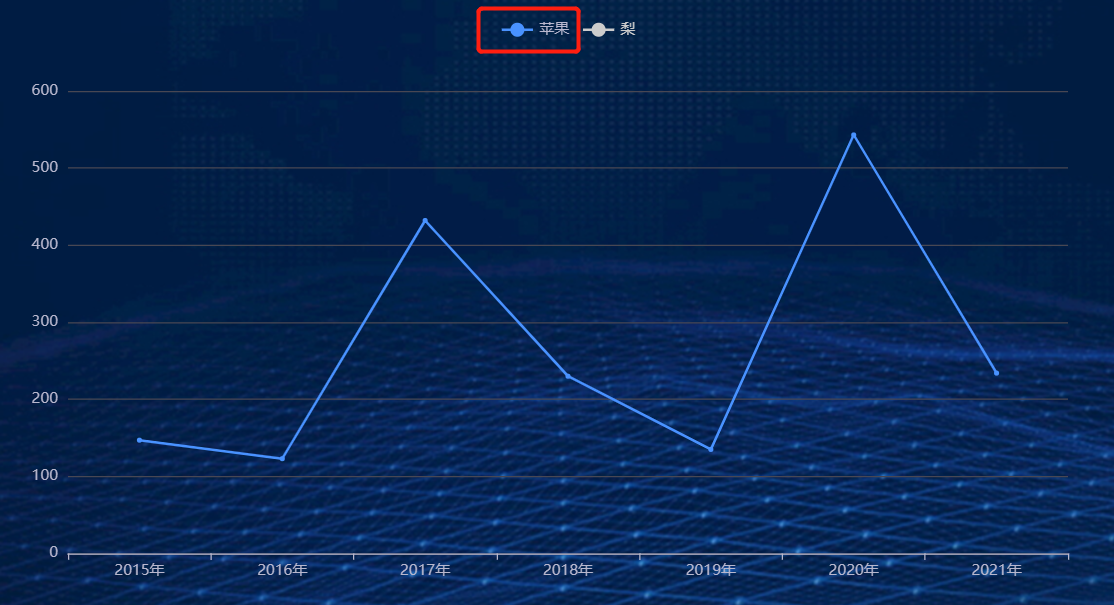
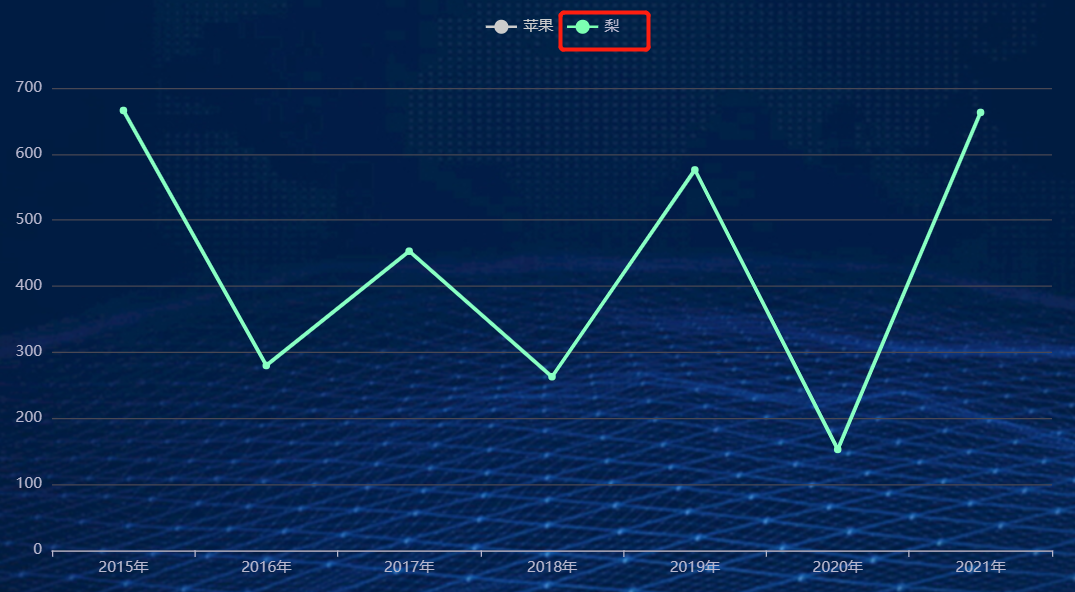
data: ['苹果', '梨'], //图例的数据数组
selectedMode: 'single' //展示单项
},
xAxis: {
type: 'category',
data: ['2015年', '2016年', '2017年', '2018年', '2019年', '2020年', '2021年']
},
yAxis: {
type: 'value'
},
series: [{//数据
name: "苹果",
data: [147, 123, 432, 230, 135, 543, 234],
type: 'line'
}, {
name: "梨",
data: [666, 280, 453, 263, 576, 153, 663],
type: 'line'
}]
}
};
},
components: {},
mounted() {
//测试一
let chartTest1 = this.$echarts.init(document.getElementById("chart-test1"), 'dark');
chartTest1.setOption(this.testOption1)
},
methods: {}
}
</script>
<style>
</style>
效果:

 浙公网安备 33010602011771号