

搭建Elasticsearch环境,搭建kibana 环境
1.检查jdk版本&&安装jdk版本
➜  ~ sudo apt install default-jre

➜  java -version
openjdk version "1.8.0_232"
OpenJDK Runtime Environment (build 1.8.0_232-8u232-b09-1~deb9u1-b09)
OpenJDK 64-Bit Server VM (build 25.232-b09, mixed mode)
2.下载elasticsearch安装包,解压
官方地址:https://www.elastic.co/downloads/past-releases
我这里安装在linux环境,下载tar包,下载完后解压:
tar -zxvf elasticsearch-5.5.3.tar.gz
3.启动elasticsearch
在bin/目录下,直接执行 ./elasticsearch命令即可。
由于elasticsearch运行的环境需求,默认的系统环境一般都需要再做调整,启动可能会报如下的一些错误:
3.1解决 内存分配问题
[root@izbp163wlhi02tcaxyuxb7z elasticsearch-5.5.3]# ./bin/elasticsearch
Java HotSpot(TM) 64-Bit Server VM warning:

INFO: os::commit_memory(0x0000000085330000, 2060255232, 0) failed; error='Cannot allocate memory' (errno=12)
#
# There is insufficient memory for the Java Runtime Environment to continue.
# Native memory allocation (mmap) failed to map 2060255232 bytes for committing reserved memory.
# An error report file with more information is saved as:
# /usr/local/wang/elasticsearch-5.5.3/hs_err_pid15795.log
原因:这是由于elasticsearch这个版本默认分配jvm空间大小为2g(不同版本默认值不一样),而示例所用服务器为1核2G,所以会报出内存分配错误,我们去配置文件修改jvm空间分配:
// 文件目录在:/elasticsearch-5.5.3/config
[root@izbp163wlhi02tcaxyuxb7z config]#  vim jvm.options
将
-Xms2g
-Xmx2g
改为
-Xms512m
-Xmx512m
如果还是报这个错误,那继续减小这个数值,这个得看机器配置。
3.2解决 用户权限问题
错误:
[2018-07-04T10:43:45,590][WARN ][o.e.b.ElasticsearchUncaughtExceptionHandler] [] uncaught exception in thread [main]
org.elasticsearch.bootstrap.StartupException: java.lang.RuntimeException: can not run elasticsearch as root
    at org.elasticsearch.bootstrap.Elasticsearch.init(Elasticsearch.java:127) ~[elasticsearch-5.5.3.jar:5.5.3]
    at org.elasticsearch.bootstrap.Elasticsearch.execute(Elasticsearch.java:114) ~[elasticsearch-5.5.3.jar:5.5.3]
    at org.elasticsearch.cli.EnvironmentAwareCommand.execute(EnvironmentAwareCommand.java:67) ~[elasticsearch-5.5.3.jar:5.5.3]
    at org.elasticsearch.cli.Command.mainWithoutErrorHandling(Command.java:122) ~[elasticsearch-5.5.3.jar:5.5.3]
    at org.elasticsearch.cli.Command.main(Command.java:88) ~[elasticsearch-5.5.3.jar:5.5.3]
    at org.elasticsearch.bootstrap.Elasticsearch.main(Elasticsearch.java:91) ~[elasticsearch-5.5.3.jar:5.5.3]
    at org.elasticsearch.bootstrap.Elasticsearch.main(Elasticsearch.java:84) ~[elasticsearch-5.5.3.jar:5.5.3]
Caused by: java.lang.RuntimeException: can not run elasticsearch as root
    at org.elasticsearch.bootstrap.Bootstrap.initializeNatives(Bootstrap.java:106) ~[elasticsearch-5.5.3.jar:5.5.3]
    at org.elasticsearch.bootstrap.Bootstrap.setup(Bootstrap.java:194) ~[elasticsearch-5.5.3.jar:5.5.3]
    at org.elasticsearch.bootstrap.Bootstrap.init(Bootstrap.java:351) ~[elasticsearch-5.5.3.jar:5.5.3]
    at org.elasticsearch.bootstrap.Elasticsearch.init(Elasticsearch.java:123) ~[elasticsearch-5.5.3.jar:5.5.3]
    ... 6 more

//查看当前用户
[root@izbp163wlhi02tcaxyuxb7z elasticsearch-5.5.3]# whoami
root
原因:由于Elasticsearch可以输入且执行脚本,为了系统安全,不允许使用root启动;我们看看有没有可用的用户
[root@izbp163wlhi02tcaxyuxb7z elasticsearch-5.5.3]# cat /etc/passwd
root:x:0:0:root:/root:/bin/bash
bin:x:1:1:bin:/bin:/sbin/nologin
daemon:x:2:2:daemon:/sbin:/sbin/nologin
adm:x:3:4:adm:/var/adm:/sbin/nologin
lp:x:4:7:lp:/var/spool/lpd:/sbin/nologin
sync:x:5:0:sync:/sbin:/bin/sync
shutdown:x:6:0:shutdown:/sbin:/sbin/shutdown
halt:x:7:0:halt:/sbin:/sbin/halt
mail:x:8:12:mail:/var/spool/mail:/sbin/nologin
operator:x:11:0:operator:/root:/sbin/nologin
games:x:12:100:games:/usr/games:/sbin/nologin
ftp:x:14:50:FTP User:/var/ftp:/sbin/nologin
nobody:x:99:99:Nobody:/:/sbin/nologin
systemd-network:x:192:192:systemd Network Management:/:/sbin/nologin
dbus:x:81:81:System message bus:/:/sbin/nologin
polkitd:x:999:997:User for polkitd:/:/sbin/nologin
postfix:x:89:89::/var/spool/postfix:/sbin/nologin
chrony:x:998:996::/var/lib/chrony:/sbin/nologin
sshd:x:74:74:Privilege-separated SSH:/var/empty/sshd:/sbin/nologin
ntp:x:38:38::/etc/ntp:/sbin/nologin
tcpdump:x:72:72::/:/sbin/nologin
nscd:x:28:28:NSCD Daemon:/:/sbin/nologin
dockerroot:x:997:994:Docker User:/var/lib/docker:/sbin/nologin
//用户名:密码:用户id:用户所在组id:备注:用户家目录:shell命令所在目录
如果发现用户都是系统自带的用户,那我们最好还是自己新建一个用户,我这里新建一个用户wang,分组为wang,密码为wang
//添加分组wang
groupadd wang

//添加用户wang,分组在wang,密码wang
useradd  wang -g wang -p wang

//授权 /usr/local/wang/elasticsearch-5.5.3目录下的文件拥有者为 wang(用户):wang(分组)
chown -R wang:wang /usr/local/wang/elasticsearch-5.5.3

//切换用户
//使用su和sudo是有区别的,使用su切换用户需要输入所切换到的用户的密码,而使用sudo则是当前用户的密码。
su wang
再次启动。
记住:后面修改文件时有时需要切到root用户,但是启动时记得切回来,不要在root下启动!
[wang@izbp163wlhi02tcaxyuxb7z elasticsearch-5.5.3]$ ./bin/elasticsearch
[2018-07-04T11:25:22,745][INFO ][o.e.n.Node               ] [] initializing ...
[2018-07-04T11:25:22,891][INFO ][o.e.e.NodeEnvironment    ] [VKU0UAW] using [1] data paths, mounts [[/ (rootfs)]], net usable_space [32.9gb], net total_space [39.2gb], spins? [unknown], types [rootfs]
[2018-07-04T11:25:22,892][INFO ][o.e.e.NodeEnvironment    ] [VKU0UAW] heap size [503.6mb], compressed ordinary object pointers [true]
[2018-07-04T11:25:22,894][INFO ][o.e.n.Node               ] node name [VKU0UAW] derived from node ID [VKU0UAWPT06PPv0aYHIuDw]; set [node.name] to override
[2018-07-04T11:25:22,894][INFO ][o.e.n.Node               ] version[5.5.3], pid[16641], build[9305a5e/2017-09-07T15:56:59.599Z], OS[Linux/3.10.0-693.2.2.el7.x86_64/amd64], JVM[Oracle Corporation/Java HotSpot(TM) 64-Bit Server VM/1.8.0_172/25.172-b11]
[2018-07-04T11:25:22,894][INFO ][o.e.n.Node               ] JVM arguments [-Xms512m, -Xmx512m, -XX:+UseConcMarkSweepGC, -XX:CMSInitiatingOccupancyFraction=75, -XX:+UseCMSInitiatingOccupancyOnly, -XX:+AlwaysPreTouch, -Xss1m, -Djava.awt.headless=true, -Dfile.encoding=UTF-8, -Djna.nosys=true, -Djdk.io.permissionsUseCanonicalPath=true, -Dio.netty.noUnsafe=true, -Dio.netty.noKeySetOptimization=true, -Dio.netty.recycler.maxCapacityPerThread=0, -Dlog4j.shutdownHookEnabled=false, -Dlog4j2.disable.jmx=true, -Dlog4j.skipJansi=true, -XX:+HeapDumpOnOutOfMemoryError, -Des.path.home=/usr/local/wang/elasticsearch-5.5.3]
[2018-07-04T11:25:25,352][INFO ][o.e.p.PluginsService     ] [VKU0UAW] loaded module [aggs-matrix-stats]
[2018-07-04T11:25:25,353][INFO ][o.e.p.PluginsService     ] [VKU0UAW] loaded module [ingest-common]
[2018-07-04T11:25:25,353][INFO ][o.e.p.PluginsService     ] [VKU0UAW] loaded module [lang-expression]
[2018-07-04T11:25:25,353][INFO ][o.e.p.PluginsService     ] [VKU0UAW] loaded module [lang-groovy]
[2018-07-04T11:25:25,353][INFO ][o.e.p.PluginsService     ] [VKU0UAW] loaded module [lang-mustache]
[2018-07-04T11:25:25,353][INFO ][o.e.p.PluginsService     ] [VKU0UAW] loaded module [lang-painless]
[2018-07-04T11:25:25,353][INFO ][o.e.p.PluginsService     ] [VKU0UAW] loaded module [parent-join]
[2018-07-04T11:25:25,353][INFO ][o.e.p.PluginsService     ] [VKU0UAW] loaded module [percolator]
[2018-07-04T11:25:25,353][INFO ][o.e.p.PluginsService     ] [VKU0UAW] loaded module [reindex]
[2018-07-04T11:25:25,353][INFO ][o.e.p.PluginsService     ] [VKU0UAW] loaded module [transport-netty3]
[2018-07-04T11:25:25,353][INFO ][o.e.p.PluginsService     ] [VKU0UAW] loaded module [transport-netty4]
[2018-07-04T11:25:25,354][INFO ][o.e.p.PluginsService     ] [VKU0UAW] no plugins loaded
[2018-07-04T11:25:28,878][INFO ][o.e.d.DiscoveryModule    ] [VKU0UAW] using discovery type [zen]
[2018-07-04T11:25:29,988][INFO ][o.e.n.Node               ] initialized
[2018-07-04T11:25:29,988][INFO ][o.e.n.Node               ] [VKU0UAW] starting ...
[2018-07-04T11:25:30,358][INFO ][o.e.t.TransportService   ] [VKU0UAW] publish_address {127.0.0.1:9300}, bound_addresses {127.0.0.1:9300}
[2018-07-04T11:25:30,377][WARN ][o.e.b.BootstrapChecks    ] [VKU0UAW] max file descriptors [65535] for elasticsearch process is too low, increase to at least [65536]
[2018-07-04T11:25:30,377][WARN ][o.e.b.BootstrapChecks    ] [VKU0UAW] max virtual memory areas vm.max_map_count [65530] is too low, increase to at least [262144]
[2018-07-04T11:25:33,470][INFO ][o.e.c.s.ClusterService   ] [VKU0UAW] new_master {VKU0UAW}{VKU0UAWPT06PPv0aYHIuDw}{gqVgexbbSx-6IWNhGSzvRw}{127.0.0.1}{127.0.0.1:9300}, reason: zen-disco-elected-as-master ([0] nodes joined)
[2018-07-04T11:25:33,589][INFO ][o.e.h.n.Netty4HttpServerTransport] [VKU0UAW] publish_address {127.0.0.1:9200}, bound_addresses {127.0.0.1:9200}
[2018-07-04T11:25:33,590][INFO ][o.e.n.Node               ] [VKU0UAW] started
[2018-07-04T11:25:33,618][INFO ][o.e.g.GatewayService     ] [VKU0UAW] recovered [0] indices into cluster_state
启动成功后,通过启动信息,我们可以知道默认的端口在9200,但是信息中有两个warn级别的日志,我们先去浏览器访问的试试
http://xx.xx.xx.xx:9200
发现还是无法访问
3.3 无法访问
原因:默认访问地址是localhost,我们要外网访问,需要去修改下配置文件,elasticsearch-5.5.3/config下的elasticsearch.yml
vim elasticsearch.yml
将network.host放开,修改为0.0.0.0下,将http.port放开,如下:
相关配置可以参考:https://juejin.im/post/5cb81bf4e51d4578c35e727d
# ---------------------------------- Network -----------------------------------
#
# Set the bind address to a specific IP (IPv4 or IPv6):
#
#network.host: 192.168.0.1
network.host: 0.0.0.0
#
# Set a custom port for HTTP:
#
http.port: 9200
discovery.seed_hosts: ["localhost", "127.0.0.1"]  #允许访问很关键
#
# For more information, consult the network module documentation.
#
再次尝试启动
3.4 解决 ERROR: [2] bootstrap checks failed
[2018-07-04T16:00:28,070][INFO ][o.e.n.Node               ] initialized
[2018-07-04T16:00:28,070][INFO ][o.e.n.Node               ] [VKU0UAW] starting ...
[2018-07-04T16:00:28,377][INFO ][o.e.t.TransportService   ] [VKU0UAW] publish_address {172.16.229.31:9300}, bound_addresses {0.0.0.0:9300}
[2018-07-04T16:00:28,401][INFO ][o.e.b.BootstrapChecks    ] [VKU0UAW] bound or publishing to a non-loopback or non-link-local address, enforcing bootstrap checks
ERROR: [2] bootstrap checks failed
[1]: max file descriptors [65535] for elasticsearch process is too low, increase to at least [65536]
[2]: max virtual memory areas vm.max_map_count [65530] is too low, increase to at least [262144]
[2018-07-04T16:00:28,485][INFO ][o.e.n.Node               ] [VKU0UAW] stopping ...
[2018-07-04T16:00:28,535][INFO ][o.e.n.Node               ] [VKU0UAW] stopped
[2018-07-04T16:00:28,536][INFO ][o.e.n.Node               ] [VKU0UAW] closing ...
[2018-07-04T16:00:28,550][INFO ][o.e.n.Node               ] [VKU0UAW] closed
————————————————
这里其实是两个错误,就是前面的两个warn信息
3.41 解决 max virtual memory areas vm.max_map_count [65530] is too low, increase to at least [262144]
原因:max_map_count这个参数就是允许一个进程在VMAs(虚拟内存区域)拥有最大数量,VMA是一个连续的虚拟地址空间,当进程创建一个内存映像文件时VMA的地址空间就会增加,当达到max_map_count了就是返回out of memory errors。
出现这个问题,我们需要切换到root用户下
// 修改下面的文件  里面是一些内核参数
vi /etc/sysctl.conf

//添加以下配置
vm.max_map_count=655360
添加完后保存,然后执行 此处要sudo 或用root权限
sudo sysctl -p
//-p   从指定的文件加载系统参数,如不指定即从/etc/sysctl.conf中加载
3.42 解决 max file descriptors [65535] for elasticsearch process is too low, increase to at least [65536]
原因:最大文件打开数量太小,出现此错误,切换到root用户下,修改limits.conf
// 编辑此文件
[root@izbp163wlhi02tcaxyuxb7z /]# vim etc/security/limits.conf
在文件后加上
* soft nofile 65536
* hard nofile 65536
5.5.3版本,此文件有这几个值,我们只需要把这几个值从65535改为65536即可。
# End of file
root soft nofile 65536
root hard nofile 65536
* soft nofile 65536
* hard nofile 65536
切回原来用户,再次重启es,检查ES是否启动成功
启动成功后提示如下:
[wang@izbp163wlhi02tcaxyuxb7z elasticsearch-5.5.3]$ ./bin/elasticsearch
[2018-07-04T16:28:45,250][INFO ][o.e.n.Node               ] [] initializing ...
[2018-07-04T16:28:45,359][INFO ][o.e.e.NodeEnvironment    ] [VKU0UAW] using [1] data paths, mounts [[/ (rootfs)]], net usable_space [32.9gb], net total_space [39.2gb], spins? [unknown], types [rootfs]
[2018-07-04T16:28:45,361][INFO ][o.e.e.NodeEnvironment    ] [VKU0UAW] heap size [503.6mb], compressed ordinary object pointers [true]
[2018-07-04T16:28:45,362][INFO ][o.e.n.Node               ] node name [VKU0UAW] derived from node ID [VKU0UAWPT06PPv0aYHIuDw]; set [node.name] to override
[2018-07-04T16:28:45,362][INFO ][o.e.n.Node               ] version[5.5.3], pid[21467], build[9305a5e/2017-09-07T15:56:59.599Z], OS[Linux/3.10.0-693.2.2.el7.x86_64/amd64], JVM[Oracle Corporation/Java HotSpot(TM) 64-Bit Server VM/1.8.0_172/25.172-b11]
[2018-07-04T16:28:45,363][INFO ][o.e.n.Node               ] JVM arguments [-Xms512m, -Xmx512m, -XX:+UseConcMarkSweepGC, -XX:CMSInitiatingOccupancyFraction=75, -XX:+UseCMSInitiatingOccupancyOnly, -XX:+AlwaysPreTouch, -Xss1m, -Djava.awt.headless=true, -Dfile.encoding=UTF-8, -Djna.nosys=true, -Djdk.io.permissionsUseCanonicalPath=true, -Dio.netty.noUnsafe=true, -Dio.netty.noKeySetOptimization=true, -Dio.netty.recycler.maxCapacityPerThread=0, -Dlog4j.shutdownHookEnabled=false, -Dlog4j2.disable.jmx=true, -Dlog4j.skipJansi=true, -XX:+HeapDumpOnOutOfMemoryError, -Des.path.home=/usr/local/wang/elasticsearch-5.5.3]
[2018-07-04T16:28:46,941][INFO ][o.e.p.PluginsService     ] [VKU0UAW] loaded module [aggs-matrix-stats]
[2018-07-04T16:28:46,941][INFO ][o.e.p.PluginsService     ] [VKU0UAW] loaded module [ingest-common]
[2018-07-04T16:28:46,941][INFO ][o.e.p.PluginsService     ] [VKU0UAW] loaded module [lang-expression]
[2018-07-04T16:28:46,941][INFO ][o.e.p.PluginsService     ] [VKU0UAW] loaded module [lang-groovy]
[2018-07-04T16:28:46,941][INFO ][o.e.p.PluginsService     ] [VKU0UAW] loaded module [lang-mustache]
[2018-07-04T16:28:46,941][INFO ][o.e.p.PluginsService     ] [VKU0UAW] loaded module [lang-painless]
[2018-07-04T16:28:46,941][INFO ][o.e.p.PluginsService     ] [VKU0UAW] loaded module [parent-join]
[2018-07-04T16:28:46,950][INFO ][o.e.p.PluginsService     ] [VKU0UAW] loaded module [percolator]
[2018-07-04T16:28:46,950][INFO ][o.e.p.PluginsService     ] [VKU0UAW] loaded module [reindex]
[2018-07-04T16:28:46,950][INFO ][o.e.p.PluginsService     ] [VKU0UAW] loaded module [transport-netty3]
[2018-07-04T16:28:46,950][INFO ][o.e.p.PluginsService     ] [VKU0UAW] loaded module [transport-netty4]
[2018-07-04T16:28:46,950][INFO ][o.e.p.PluginsService     ] [VKU0UAW] no plugins loaded
[2018-07-04T16:28:50,067][INFO ][o.e.d.DiscoveryModule    ] [VKU0UAW] using discovery type [zen]
[2018-07-04T16:28:51,171][INFO ][o.e.n.Node               ] initialized
[2018-07-04T16:28:51,172][INFO ][o.e.n.Node               ] [VKU0UAW] starting ...
[2018-07-04T16:28:51,484][INFO ][o.e.t.TransportService   ] [VKU0UAW] publish_address {172.16.229.31:9300}, bound_addresses {0.0.0.0:9300}
[2018-07-04T16:28:51,513][INFO ][o.e.b.BootstrapChecks    ] [VKU0UAW] bound or publishing to a non-loopback or non-link-local address, enforcing bootstrap checks
[2018-07-04T16:28:54,650][INFO ][o.e.c.s.ClusterService   ] [VKU0UAW] new_master {VKU0UAW}{VKU0UAWPT06PPv0aYHIuDw}{1HxIYnvrQ9KkyLOzhVwe3Q}{172.16.229.31}{172.16.229.31:9300}, reason: zen-disco-elected-as-master ([0] nodes joined)
[2018-07-04T16:28:54,708][INFO ][o.e.h.n.Netty4HttpServerTransport] [VKU0UAW] publish_address {172.16.229.31:9200}, bound_addresses {0.0.0.0:9200}
[2018-07-04T16:28:54,708][INFO ][o.e.n.Node               ] [VKU0UAW] started
[2018-07-04T16:28:54,738][INFO ][o.e.g.GatewayService     ] [VKU0UAW] recovered [0] indices into cluster_state
[2018-07-04T16:38:43,328][INFO ][o.e.c.m.MetaDataCreateIndexService] [VKU0UAW] [.kibana] creating index, cause [api], templates [], shards [1]/[1], mappings [_default_, index-pattern, server, visualization, search, timelion-sheet, config, dashboard, url]
仔细检查,日志都是info级别,没有问题,去页面访问xx.xx.xx.xx:9200
页面会出现如下信息:
{
    "name": "VKU0UAW",
    "cluster_name": "elasticsearch",
    "cluster_uuid": "TTJuSo16Tny1lUoFmnF-dA",
    "version": {
        "number": "5.5.3",
        "build_hash": "9305a5e",
        "build_date": "2017-09-07T15:56:59.599Z",
        "build_snapshot": false,
        "lucene_version": "6.6.0"
    },
    "tagline": "You Know, for Search"
}
至此,Elasticsearch安装完毕。
3.5 后台启动Elasticsearch
下面这种方式是在前台启动,我们关闭命令行或者退出,应用就会关闭
[wang@izbp163wlhi02tcaxyuxb7z elasticsearch-5.5.3]$ ./bin/elasticsearch
所以,我们需要在后台启动,这样当我们退出时,应用仍在后台运行
[wang@izbp163wlhi02tcaxyuxb7z elasticsearch-5.5.3]$ ./bin/elasticsearch -d
3.6 停止后台服务
前台启动,直接ctrl+c退出即可,后台启动,停止时可以直接杀掉进程
[wang@izbp163wlhi02tcaxyuxb7z bin]$ ./elasticsearch -d
[wang@izbp163wlhi02tcaxyuxb7z bin]$ jps
3697 Elasticsearch
3771 Jps
[wang@izbp163wlhi02tcaxyuxb7z bin]$ kill -9 3697
4.下载 kibana安装包,解压
每一个版本的es都有一个对应的Kibana版本,我们可以去下面的地址查找最新的版本,建议和es相同版本;
下载地址:https://www.elastic.co/downloads/past-releases
//解压:
tar -zxvf kibana-5.5.3-linux-x86_64.tar.gz
5.启动 kibana
[wang@izbp163wlhi02tcaxyuxb7z kibana-5.5.3-linux-x86_64]$ ./bin/kibana
kibana默认是在前台启动,可以通过ctrl+c命令停止。
解压时的文件夹下装着所有kibana相关的文件,我们不用新建其他文件,当我们需要删除时,直接删除此文件夹即可。
启动后消息如下:
[wang@izbp163wlhi02tcaxyuxb7z kibana-5.5.3-linux-x86_64]$ ./bin/kibana
  log   [03:49:45.116] [info][status][plugin:kibana@5.5.3] Status changed from uninitialized to green - Ready
  log   [03:49:45.188] [info][status][plugin:elasticsearch@5.5.3] Status changed from uninitialized to yellow - Waiting for Elasticsearch
  log   [03:49:45.215] [error][admin][elasticsearch] Request error, retrying
HEAD http://localhost:9200/ => connect ECONNREFUSED 127.0.0.1:9200
  log   [03:49:45.219] [info][status][plugin:console@5.5.3] Status changed from uninitialized to green - Ready
  log   [03:49:45.224] [warning][admin][elasticsearch] Unable to revive connection: http://localhost:9200/
  log   [03:49:45.225] [warning][admin][elasticsearch] No living connections
  log   [03:49:45.228] [error][status][plugin:elasticsearch@5.5.3] Status changed from yellow to red - Unable to connect to Elasticsearch at http://localhost:9200.
  log   [03:49:45.251] [info][status][plugin:metrics@5.5.3] Status changed from uninitialized to green - Ready
  log   [03:49:45.454] [info][status][plugin:timelion@5.5.3] Status changed from uninitialized to green - Ready
  log   [03:49:45.459] [info][listening] Server running at http://localhost:5601
  log   [03:49:45.461] [error][status][ui settings] Status changed from uninitialized to red - Elasticsearch plugin is red
  log   [03:49:47.735] [warning][admin][elasticsearch] Unable to revive connection: http://localhost:9200/
  log   [03:49:47.735] [warning][admin][elasticsearch] No living connections
  log   [03:49:50.244] [warning][admin][elasticsearch] Unable to revive connection: http://localhost:9200/
  log   [03:49:50.245] [warning][admin][elasticsearch] No living connections
  log   [03:49:52.751] [warning][admin][elasticsearch] Unable to revive connection: http://localhost:9200/
  log   [03:49:52.751] [warning][admin][elasticsearch] No living connections
    ......
我们可以看到,他会默认去链接同一台服务器上的9200端口提供的服务,如果没有启动elasticSearch服务,他会一直尝试去连接,我们启动下elasticSearch;
访问:
http://xx.xx.xx.xx:5601
然后发现访问不了,我们注意上面的日志,有这么一句:
log [03:49:45.459] [info][listening] Server running at http://localhost:5601
5.1 kibana外网无法访问
在config/kibana.yml中,有如下配置,意思是默认是localhost,外网是无法访问的,如果外网想访问,那需要修改一下server.host
# Kibana is served by a back end server. This setting specifies the port to use.
#server.port: 5601

# Specifies the address to which the Kibana server will bind. IP addresses and host names are both valid values.
# The default is 'localhost', which usually means remote machines will not be able to connect.
# To allow connections from remote users, set this parameter to a non-loopback address.
#server.host: "localhost"
我们放开端口,放开server.host,并修改如下:
server.port: 5601
server.host: 0.0.0.0
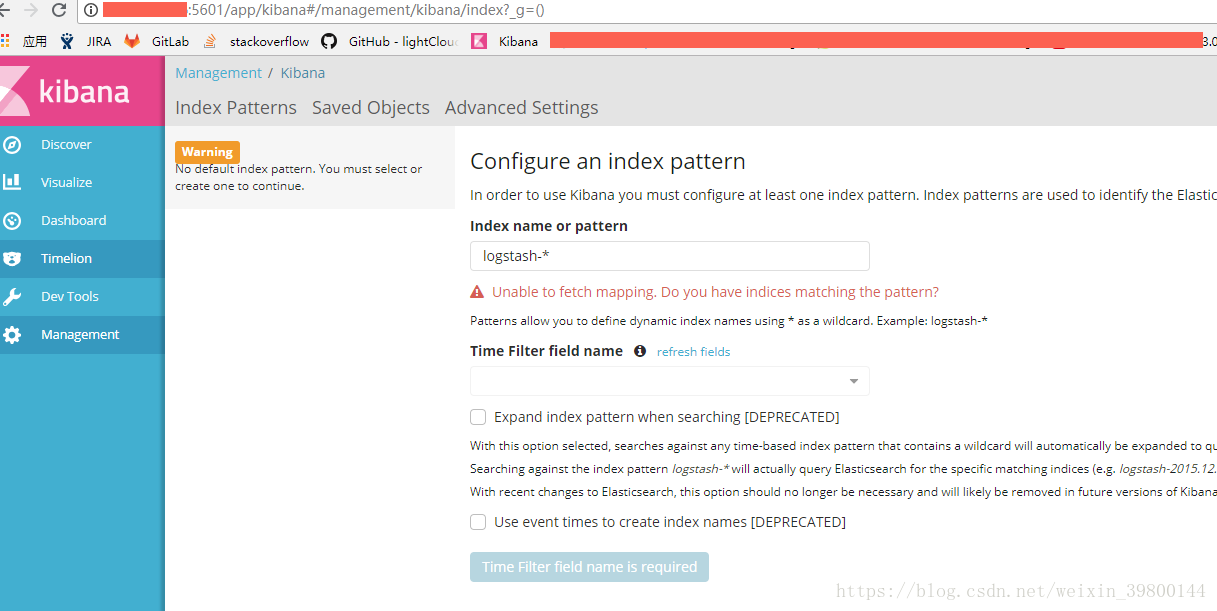
意思是任何人都可以访问,然后再次启动,访问http://xx.xx.xx.xx:5601
出现如下页面,说明大功告成。
5.2kibana后台启动
当使用前台启动时,如果我们退出终端,服务就会停止,我们可以使用nohup命令来启动;
[root@izbp163wlhi02tcaxyuxb7z kibana-5.5.3-linux-x86_64]# nohup ./bin/kibana &
nohup命令:如果你在运行一个进程,你希望在退出账户或者关闭终端时继续运行相应的进程,就可以使用nohup(no hang up);该命令格式为:nohup command &
6. kibana目录结构分析
我们查看下kibana的目录
[wang@izbp163wlhi02tcaxyuxb7z kibana-5.5.3-linux-x86_64]$ ls
bin  config  data  LICENSE.txt  node  node_modules  NOTICE.txt  optimize  package.json  plugins  README.txt  src  ui_framework  webpackShims
bin: 二进制脚本,包括 kibana 启动 Kibana 服务和 kibana-plugin 安装插件。
config: 配置文件,包括 kibana.yml 。
data: Kibana 和其插件写入磁盘的数据文件位置。
optimize: 编译过的源码。某些管理操作(如,插件安装)导致运行时重新编译源码。
plugins: 插件文件位置。每一个插件都有一个单独的二级目录。


 浙公网安备 33010602011771号