

pytorch(2):线性回归
一、基本公式
理想的函数:
存在噪音:
优化函数转化为:
更新超参数
二、代码
import numpy as np
import matplotlib.pyplot as plt
class LineRegression():
    def __init__(self):
        pass
    def compute_error_for_line_given_points(self, b, w, points):
        """计算给定超参数【W, B】的误差"""
        totleError = 0
        for i in range(0, len(points)):
            x = points[i, 0]
            y = points[i, 1]
            totleError = totleError + (y-(w*x + b))**2
        return totleError/float(len(points))
    def step_gradient(self, b, w, points, lr):
        """梯度下降法更新w,b的值"""
        b_gradient = 0
        w_gradient = 0
        N = float(len(points))
        for i in range(len(points)):
            x = points[i, 0]
            y = points[i, 1]
            b_gradient = b_gradient - 2*(y-(w*x+b)) / N
            w_gradient = w_gradient - 2*x*(y-(w*x+b)) / N
        b_new = b - (lr * b_gradient)
        w_new = w - (lr * w_gradient)
        return [b_new, w_new]
    def gradient_descent_runner(self, points, b, w, lr, iterations):
        """梯度下降"""
        for i in range(iterations):
            b, w = self.step_gradient(b, w, np.array(points), lr)
        return [b,w]
    def run(self):
        points = np.genfromtxt("data.csv", delimiter=",")
        lr = 0.0001
        initial_b = 0
        initial_w = 0
        iterations = 1000
        print(
            f"Starting project descent at b = {initial_b}, w = {initial_w},error = {self.compute_error_for_line_given_points(initial_b, initial_w, points)}")
        print('\nRunning...')
        [b,w] = self.gradient_descent_runner(points,initial_b,initial_w,lr,iterations)
        print(f"\nAfter project descent at b = {b}, w = {w},error = {self.compute_error_for_line_given_points(b,w,points)}")
        print('\nb:{},w:{}'.format(b, w))
        x = points[:, 0]
        y = w * x + b
        plt.scatter(points[:, 0], points[:, 1], c='', edgecolors='b', s=15, label='orginal')
        plt.plot(x, y, c='black', label='predict', linestyle=':')
        plt.legend()
        plt.show()
if __name__ == '__main__':
    LineRegression().run()
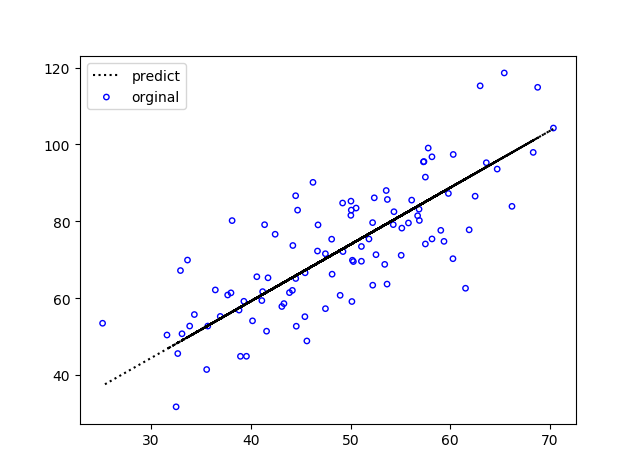
三、画图

 浙公网安备 33010602011771号