
科学计算和可视化
numpy和matplotlib库的学习笔记
numpy库
np.array([x,y,z],dtype=int) 从Python 列表和元组创造数组
np.arange(x,y,i) 创建一个由x到y,以;为步长的数组
np.linspace(x,y,n) 创建一个由x到y,等分成n个元素的数组
np.indices((m,n)) 创建一个m行n列的矩阵
np.random.rand(m,n) 创建一个㎡行n列的随机数组
np.ones((m,n),dtype) 创建一个m行n列全1的数组,dtype 是数据类型
np.empty((m,n),dtype) 创建一个m行n列全0的数组,dtype 是数据类型
ndarray 类
ndarray.ndim 数组轴的个数,也被称作秩
ndarray.shape 数组在每个维度上大小的整数元组
ndarray.size 数组元素的总个数
ndarray.dtype 数组元素的数据类型,dtype 类型可以用于创建数组中
ndarray.itemsize 数组中每个元素的字节大小
ndarray.data 包含实际数组元素的缓冲区地址
ndarray.flat 数组元素的选代器
numpy 库运算函数
np.abs(x) 计算基于元素的整形,浮点或复数的绝对值。
np.sqrt(x) 计算每个元素的平方根
np.squre(x) 计算每个元素的平方
np.sign(x) 计算每个元素的符号:1(+),0,-1(-)
np.ceil(x) 计算大于或等于每个元素的最小值
np.floor(x) 计算小于或等于每个元素的最大值
np.rint(xl, out]) 圆整,取每个元索为最近的整数,保留数据类型
np.exp(xL, out]) 计算每个元素指数值
matplotlib库
plt.figure(figsize-None,facecolor=None) 创建一个全局绘图区域
plt.axes(rect,axisbg='w") 创建一个坐标系风格的子绘图区域
plt.subplot(nrows,ncols,plot_number) 在全局绘图区域中创建一个子绘图区城
plt.subplots_adjust() 调整子图区域的布局
plt.legend() 在绘图区域中方式绘图(也称图注)
plt.show() 显示创建的绘图对象
plt.matshow() 在窗口显示数组矩阵
plt.imshow() 在 axes 上显示图像
plt.imsave() 保存数组为图像文件
plt.imread() 从图像文件中读取数组
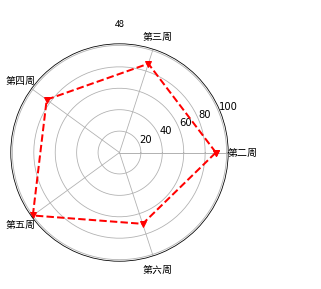
成绩雷达图
import numpy as np
import matplotlib.pyplot as plt
las=['第二周','第三周','第四周','第五周','第六周']
datal=5
data=np.array([90,87.2,84,100,70])
angles=np.linspace(0,2*np.pi,datal,endpoint=False)
data=np.concatenate((data,[data[0]]))
angles=np.concatenate((angles,[angles[0]]))
fig=plt.figure()
ax=fig.add_subplot(111,polar=True)
ax.plot(angles,data,'rv--',linewidth=2)
plt.thetagrids(angles*180/np.pi,las,fontproperties="SimHei")
ax.set_title("48",fontproperties="SimHei")
ax.grid(True)
plt.show()
posted on 2020-05-06 13:36 zhangsijie 阅读(169) 评论(0) 收藏 举报

 浙公网安备 33010602011771号