

oracle数据库read by other session等待事件性能优化
一、现象
应用反馈,从本周一(2月21日)开始,每天0-1点之间webedi系统特别慢,1点之后恢复。
二、分析原因
1、 确认是数据库性能问题
生成2月18日凌晨和2月23日凌晨的awr报告,为同一个时间段的3个小时的报告,其中2月18日DB time为4.57min,2月23日的DB Time为743min。由此可以看出应用反馈的系统慢跟数据库有关。
2、 最大等待事件
从top 10的等待事件中看,read by other session占据了83.7%,可以断定跟这个等待事件有关。
3、 等待事件的中被阻塞者和阻塞者确认
通过dba_hist_active_sess_history视图中23日凌晨有“read by other session”等待事件的sql。
select a.sql_id,count(*)
from dba_hist_active_sess_history a
where a.sample_time between to_date('20220222 23:00:00','yyyymmdd hh24:mi:ss')
and to_date('20220223 02:00:00','yyyymmdd hh24:mi:ss')
and a.event='read by other session'
and a.con_id=3
group by a.sql_id
order by 2 desc
;
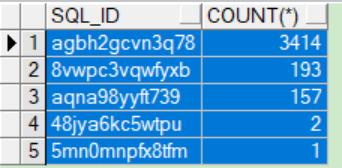
结果如下,大部分为sql_id为agbh2gcvn3q78的sql
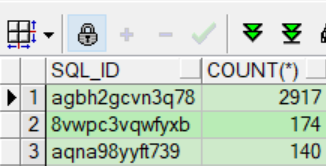
通过查看sql_idagbh2gcvn3q78的阻塞者,发现被同一个sql_id阻塞
select sql_id,count(*)
from dba_hist_active_sess_history a
where a.sample_time between to_date('20220222 23:00:00','yyyymmdd hh24:mi:ss')
and to_date('20220223 02:00:00','yyyymmdd hh24:mi:ss')
and a.con_id=3
and (a.session_id,a.session_serial#) in
(
select distinct t.BLOCKING_SESSION,t.BLOCKING_SESSION_serial#
from dba_hist_active_sess_history t
where t.sample_time between to_date('20220222 23:00:00','yyyymmdd hh24:mi:ss')
and to_date('20220223 02:00:00','yyyymmdd hh24:mi:ss')
and t.event='read by other session'
and t.con_id=3
)
group by sql_id
- order by 2 desc
结果显示,被同一个sql_id阻塞
三、解决方案
1、 sql_id对应的sql
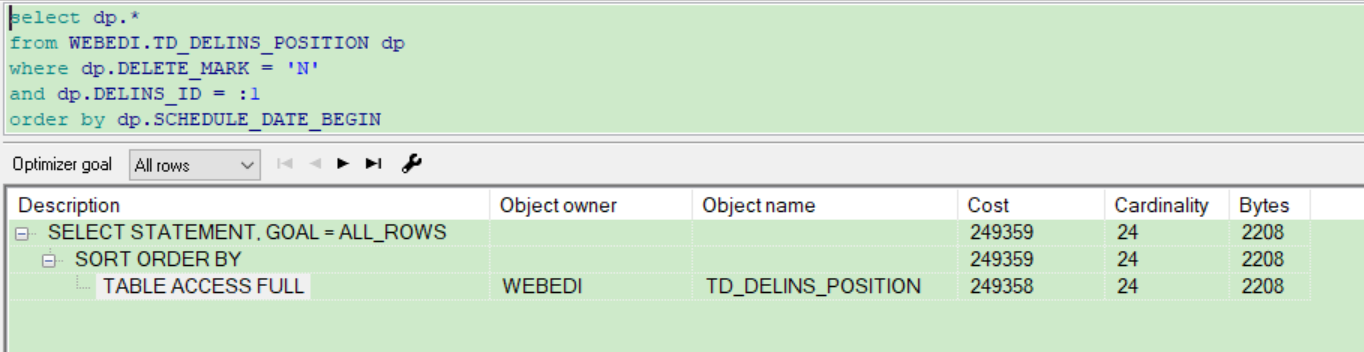
select dp.* from TD_DELINS_POSITION dp where dp.DELETE_MARK = 'N' and dp.DELINS_ID = :1 order by dp.SCHEDULE_DATE_BEGIN
2、 执行时长和执行计划
从awr报告中看,该sql执行了63次,每次608秒。从执行计划看,该sql走的是TD_DELINS_POSITION 表的全表扫描。
Sql执行计划具体如下:
3、 原因分析
该表7.2G的大小,78032345条记录。所以每执行一次,效率本来就不高,加上其他session执行这个sql时候的阻塞,造成了执行时间长的现象。
4、 解决方案建议
该表有78032345条记录,where条件中用到的DELINS_ID有3221214个不同的值,在不用做应用调整的情况下,建议在此列增加一个索引。
Create index xxx on TD_DELINS_POSITION(DELINS_ID);
5、结果
增加索引后的第二天,sql执行事件由原来10分钟变为0.03秒。

 浙公网安备 33010602011771号