

Kubernetes自定义监控指标 —— Prometheus Adapter
1、概述
- Core metrics(核心指标):从 Kubelet、cAdvisor 等获取度量数据,再由metrics-server提供给 kube-scheduler、HPA、 控制器等使用。
- Custom Metrics(自定义指标):由Prometheus Adapter提供API custom.metrics.k8s.io,由此可支持任意Prometheus采集到的指标。

2、部署Prometheus-Adapter
Prometheus可以采集其它各种指标,但是Prometheus采集到的metrics并不能直接给Kubernetes用,因为两者数据格式不兼容,因此还需要另外一个组件Prometheus-Adapter,将Prometheus的metrics数据格式转换成k8s API接口能识别的格式。由于prometheus-adapter是自定义API Service,所以还需要用Kubernetes aggregator在主API服务器中注册,以便直接通过/apis/来访问。
Prometheus-Adapter项目地址:https://github.com/kubernetes-sigs/prometheus-adapter
2.1 使用helm部署
helm repo add prometheus-community https://prometheus-community.github.io/helm-charts
helm repo update
helm install my-release prometheus-community/prometheus-adapter
2.2 使用yaml文件形式部署
除了可以通过helm形式部署,也可以通过kubectl apply形式进行部署。
kubectl create namespace monitoring # 如果需要将prometheus-adapter部署到其他命名空间下,需要手动修改manifests底下的yaml配置文件
kubectl create -f manifests/ # 下载最新稳定版本源码,并进入到prometheus-adapter/deploy目录下进行prometheus-adapter组件安装Prometheus-Adapter组件部署文件清单:

注意 1:不管是使用helm安装,还是使用yaml文件形式进行安装,安装Prometheus-Adapter前,需要提前装好Prometheus,并保证Prometheus中已经拉取并保存了所需的自定义指标数据,这时通过安装Prometheus-Adapter组件,可以将用PromQL查询到的指标数据转换成k8s API接口能识别的格式。
注意 2:不管是使用helm安装,还是使用yaml文件形式进行安装,配置文件都需要按需修改,比如修改custom-metrics-apiservice.yaml配置文件,将服务地址改成实际的prometheus-adapter组件地址。
apiVersion: apiregistration.k8s.io/v1
kind: APIService
metadata:
  annotations:
    meta.helm.sh/release-name: prometheus-adapter
    meta.helm.sh/release-namespace: monitoring-system
  creationTimestamp: "2023-03-20T01:50:17Z"
  labels:
    app.kubernetes.io/component: metrics
    app.kubernetes.io/instance: prometheus-adapter
    app.kubernetes.io/managed-by: Helm
    app.kubernetes.io/name: prometheus-adapter
    app.kubernetes.io/part-of: prometheus-adapter
    app.kubernetes.io/version: v0.10.0
    helm.sh/chart: prometheus-adapter-4.1.1
  name: v1beta1.custom.metrics.k8s.io
spec:
  group: custom.metrics.k8s.io
  groupPriorityMinimum: 100
  insecureSkipTLSVerify: true
  service:
    name: prometheus-adapter
    namespace: monitoring
    port: 443
  version: v1beta1
  versionPriority: 100
Prometheus-Adapter组件以及其依赖组件(Prometheus等)均部署成功后,客户端便可以通过Prometheus-Adapter提供的 RESTful 接口获取指标(需要保障Prometeus中已经拉取并保存了所需的自定义指标数据)。
3、通过Prometheus-Adapter获取自定义指标
在第二章节部署Prometheus-Adapter组件的时候通过创建对应APIService资源对象把Prometheus-Adapter组件作为自定义Apiserver注册到原生的Apiserver上,因此可以通过访问原生K8s Apiserver来访问Prometheus-Adapter组件。
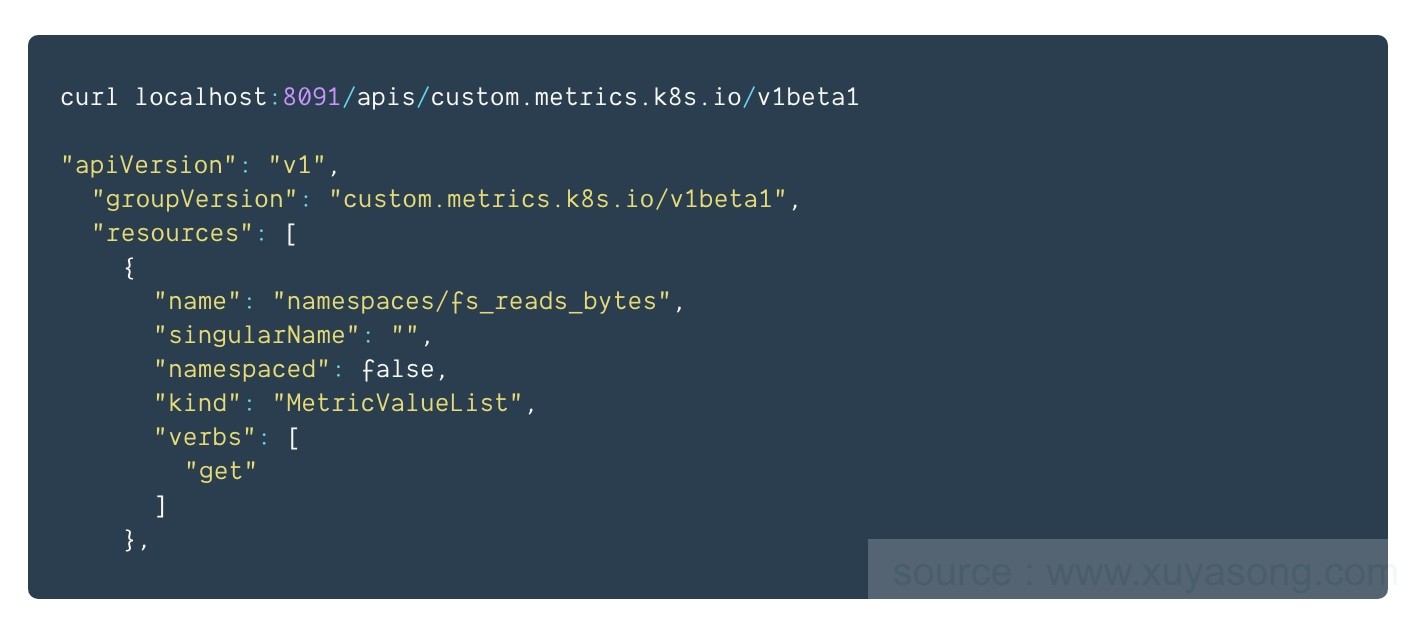
假设注册的 APIService为custom.metrics.k8s.io/v1beta1,其中/apis/custom.metrics.k8s.io/v1beta1 接口用于获取已定义的自定义指标的值。另外 metrics 的 API path 是分为 namespaced 和 non-namespaced 类型的。
3.1 namespaced类型
获取指定 namespace 下指定 object 类型和名称的 metrics。
kubectl get --raw "/apis/custom.metrics.k8s.io/v1beta1/namespaces/{namespace-name}/{object-type}/{object-name}/{metric-name...}" | jq .如获取 monitor 命名空间下名为 grafana 的 pod 的start_time_seconds metric。
kubectl get --raw "/apis/custom.metrics.k8s.io/v1beta1/namespaces/monitor/pods/grafana/start_time_seconds" | jq .获取指定 namespace 下所有特定 object 类型的 metrics。
kubectl get --raw "/apis/custom.metrics.k8s.io/v1beta1/namespaces/{namespace-name}/pods/*/{metric-name...}" | jq .如获取 monitor 命名空间下名为所有 pod 的 start_time_seconds metric。
kubectl get --raw "/apis/custom.metrics.k8s.io/v1beta1/namespaces/monitor/pods/*/start_time_seconds" | jq .使用 labelSelector 可以选择带有特定 label 的 object。
kubectl get --raw "/apis/custom.metrics.k8s.io/v1beta1/namespaces/{namespace-name}/{object-type}/{object-name}/{metric-name...}?labelSelector={label-name}" | jq .
kubectl get --raw "/apis/custom.metrics.k8s.io/v1beta1/namespaces/{namespace-name}/pods/*/{metric-name...}?labelSelector={label-name}" | jq .
示例 1:
通过Prometheus Adapter组件获取custom-metrics-ns-zpz-0625命名空间下所有Pod的http_requests_count5xx指标。
kubectl get --raw "/apis/custom.metrics.k8s.io/v1beta1/namespaces/custom-metrics-ns-zpz-0625/pods/*/http_requests_count5xx"
{
	"kind": "MetricValueList",
	"apiVersion": "custom.metrics.k8s.io/v1beta1",
	"metadata": {},
	"items": [{
		"describedObject": {
			"kind": "Pod",
			"namespace": "custom-metrics-ns-zpz-0625",
			"name": "custom-metrics-5xx-deploy-5f55d579fb-djqrw",
			"apiVersion": "/v1"
		},
		"metricName": "http_requests_count5xx",
		"timestamp": "2023-07-06T07:08:48Z",
		"value": "0",
		"selector": null
	}, {
		"describedObject": {
			"kind": "Pod",
			"namespace": "custom-metrics-ns-zpz-0625",
			"name": "custom-metrics-deploy-0626-1-v1-69b89f5c97-dmx2d",
			"apiVersion": "/v1"
		},
		"metricName": "http_requests_count5xx",
		"timestamp": "2023-07-06T07:08:48Z",
		"value": "0",
		"selector": null
	}]
}
3.2 non-namespaced类型
non-namespaced 和 namespaced 的类似,主要有 node,namespace,PersistentVolume 等。non-namespaced 访问有些与 custom metrics API 描述不一致
访问 object 为 namespace 的方式如下如下。
kubectl get --raw "/apis/custom.metrics.k8s.io/v1beta1/namespaces/{namespace-name}/metrics/{metric-name...}" | jq .
kubectl get --raw "/apis/custom.metrics.k8s.io/v1beta1/namespaces/*/metrics/{metric-name...}" | jq .
访问 node 的方式如下。
kubectl get --raw "/apis/custom.metrics.k8s.io/v1beta1/nodes/{node-name}/{metric-name...}" | jq . 示例 1:
kubectl get --raw "/apis/custom.metrics.k8s.io/v1beta1/nodes/node1/kubelet_pleg_relist_duration_seconds_count"
{
	"kind": "MetricValueList",
	"apiVersion": "custom.metrics.k8s.io/v1beta1",
	"metadata": {},
	"items": [{
		"describedObject": {
			"kind": "Node",
			"name": "node1",
			"apiVersion": "/v1"
		},
		"metricName": "kubelet_pleg_relist_duration_seconds_count",
		"timestamp": "2023-07-06T07:20:41Z",
		"value": "2312911",
		"selector": null
	}]
}![]() 3、基于自定义指标的HPA
3、基于自定义指标的HPA
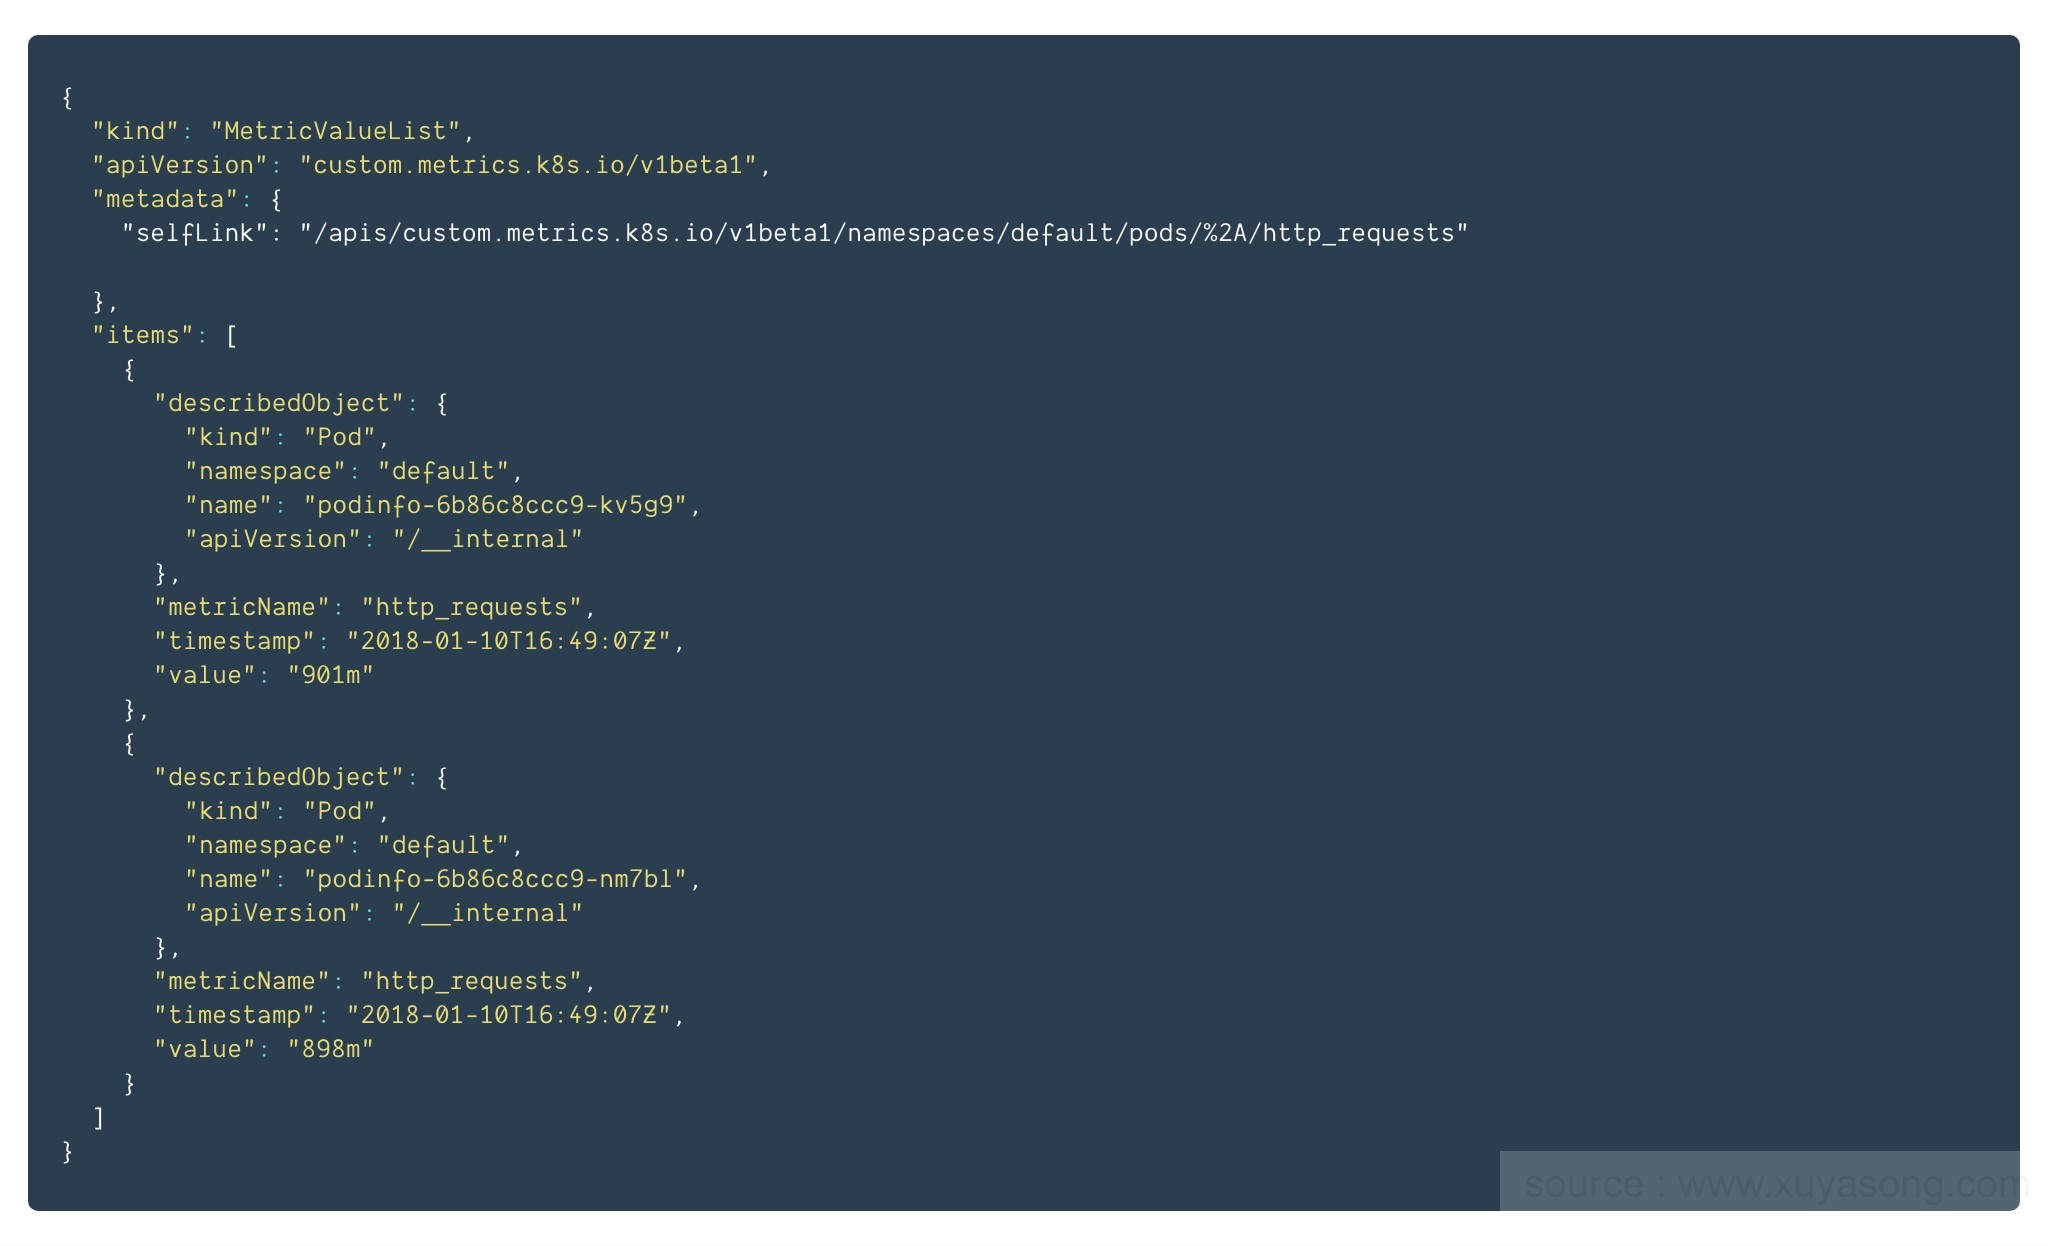
创建一个HPA,当请求数超过每秒10次时进行自动扩容
apiVersion: autoscaling/v2beta1
kind: HorizontalPodAutoscaler
metadata:
  name: podinfo
spec:
  scaleTargetRef:
    apiVersion: extensions/v1beta1
    kind: Deployment
    name: podinfo
  minReplicas: 2
  maxReplicas: 10
  metrics:
  - type: Pods
    pods:
      metricName: http_requests
      targetAverageValue: 10
查看HPA:
$ kubectl get hpa
NAME      REFERENCE            TARGETS     MINPODS   MAXPODS   REPLICAS   AGE
podinfo   Deployment/podinfo   899m / 10   2         10        2          1m
对Pod试压:
#install hey
$ go get -u github.com/rakyll/hey<   br >
#do 10K requests rate limited at 25 QPS
$ hey -n 10000 -q 5 -c 5 http://PODINFO_SVC_IP:9898/healthz
HPA发挥作用:
Events:
  Type    Reason             Age   From                       Message
  ----    ------             ----  ----                       -------
  Normal  SuccessfulRescale  5m    horizontal-pod-autoscaler  New size: 3; reason: pods metric http_requests above target
  Normal  SuccessfulRescale  21s   horizontal-pod-autoscaler  New size: 2; reason: All metrics below target
4、关于Prometheus-Adapter
- lister-kubeconfig: 默认使用in-cluster方式
- metrics-relist-interval: 更新metric缓存值的间隔,最好大于等于Prometheus 的scrape interval,不然数据会为空
- Prometheus-url: 对应连接的Prometheus地址
- config: 一个yaml文件,配置如何从Prometheus获取数据,并与k8s的资源做对应,以及如何在api接口中展示。
5、总结

Kubernetes自定义监控指标Prometheus-Adapter一般通过Prometheus来提供监控指标数据(其他自定义监控指标采集工具还包括Microsoft Azure Adapter、
Google Stackdriver等),一般来说,核心指标作HPA已经足够,但如果想根据自定义指标:如请求qps/5xx错误数来实现HPA,这时候就需要在集群中部署
Prometheus-Adapter了,通过将Prometheus-adpater(自定义apiserver)聚合到原生Kubernetes apiserver,实现和核心指标(metric-server)同样的效果。

 浙公网安备 33010602011771号