


promethus监控node
1、下载node_exporter
https://github.com/prometheus/node_exporter/releases
2、启动node_exporter
nohup ./node_exporter & > nohup.out &
3、prometheus 配置
 - job_name: 'linux-server'

   static_configs:
   - targets: ['10.20.31.207:9100']
     labels:
       instance: linux-207
   - targets: ['10.20.31.208:9100']
     labels:
       instance: linux-208

4、grafana 配置 dashbord
Grafana通过Dashboard展示数据,一个Dashboard上可以有多个图表。可以自己创建,也可以将现有的导入,在Grafana Labs中,有很多分享的Dashboard,我们找一个合适的。
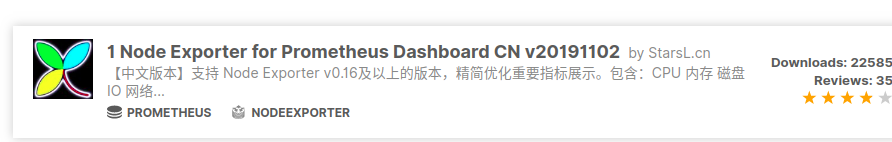
点进去,复制它的ID![[外链图片转存失败,源站可能有防盗链机制,建议将图片保存下来直接上传(img-r3P31UiC-1584803378870)(/home/floyd/PersonalCode/blog/source/_posts/用Prometheus和Grafana监控你的服务器/image-20200321223832988.png)]](https://img-blog.csdnimg.cn/20200321231338116.png)
回到Grafana,点击 创建 - Import ,输入上面的ID8919,加载成功可显示如下界面
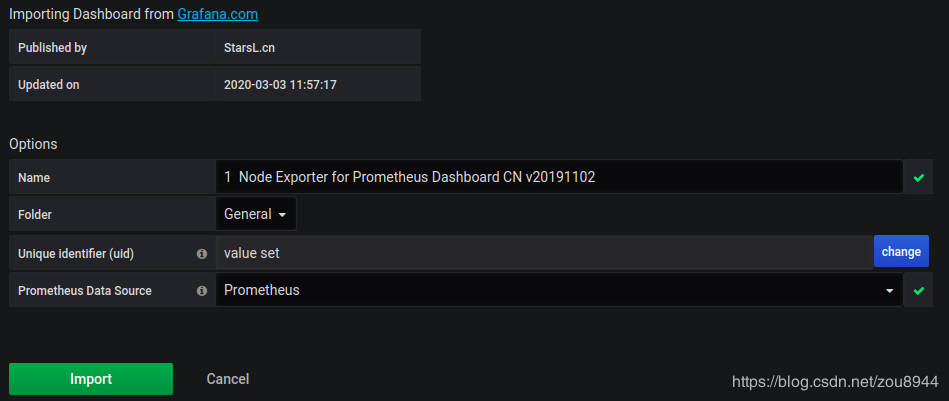
点击导入, 这里详细地展示了你的设备信息。
注意:如果grafana没有添加Prometheus数据源话,需要先设置数据源(点击设置 - Data Sources - Add data source - Prometheus)。


 浙公网安备 33010602011771号