subplots
import numpy as np
from matplotlib import pyplot as plt
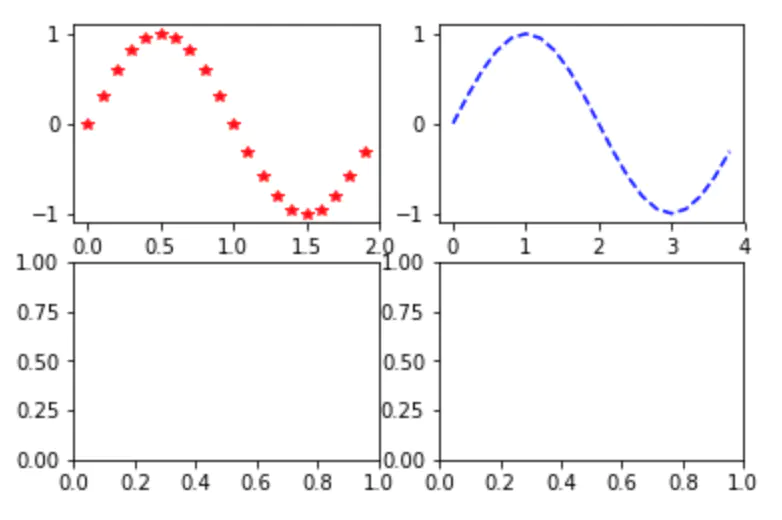
t=np.arange(0.0,2.0,0.1)
s=np.sin(t*np.pi)
figure,ax=plt.subplots(1,1)
ax.plot(t,s,'r*')
ax.plot(t*2,s,'b--')
figure
这里的的ax是matplotlib.axes._subplots.AxesSubplot 这个类型的,我们可以理解为这是一个子plot,我们在这上面操作它把图像画到figure上面去。我们直接根据列表的下标指定画图的位置。最后显示figure即可。

 浙公网安备 33010602011771号