<!DOCTYPE html>
<head>
<meta charset="utf-8">
<title>ECharts</title>
</head>
<body>
<!-- 为ECharts准备一个具备大小(宽高)的Dom -->
<div id="main" style="height:400px;margin-top: 100px;"></div>
<!-- ECharts单文件引入 -->
<script src="http://echarts.baidu.com/build/dist/echarts.js"></script>
<script type="text/javascript">
// 路径配置
require.config({
paths: {
echarts: 'http://echarts.baidu.com/build/dist'
}
});
// 使用
require(
[
'echarts',
'echarts/chart/line', // 使用柱状图就加载bar模块,按需加载
'echarts/chart/bar'
],
function (ec) {
// 基于准备好的dom,初始化echarts图表
var myChart = ec.init(document.getElementById('main'));
var option = {
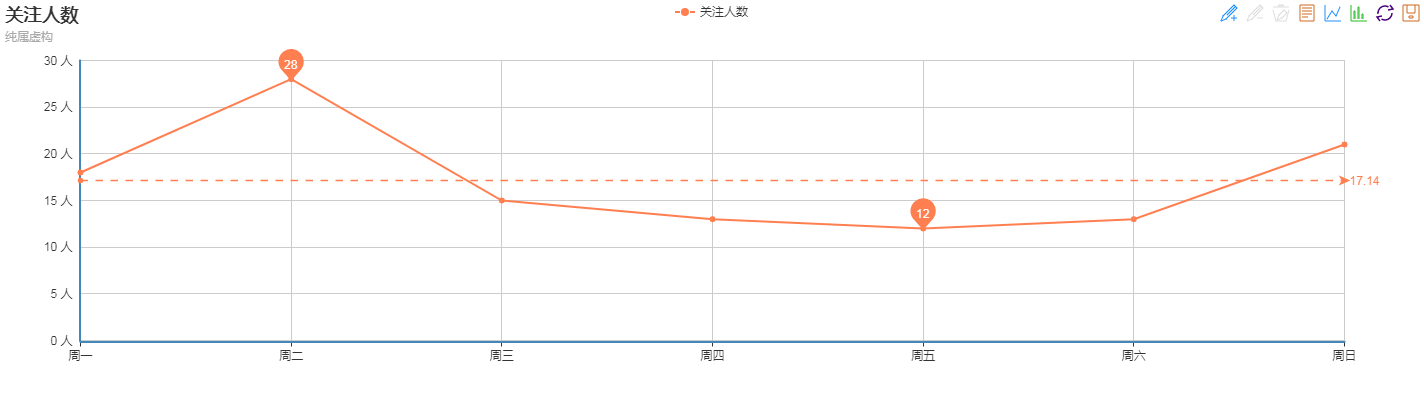
title : {
text: '关注人数',
subtext: '纯属虚构'
},
tooltip : {
axisPointer:{type:'none'},
trigger: 'axis' //提示信息
},
legend: {
data:['关注人数'] //图例
},
toolbox: {
show : true, //工具箱显示
feature : {
mark : {show:true}, //辅助线开关
dataView : {show: true, readOnly: false},//刷新数据
magicType : {show: true, type: ['line', 'bar']},//切换图
restore : {show: true}, //还原
saveAsImage : {show: true} //保存图片
}
},
calculable : true,//拖拽重新计算特性
xAxis : [
{
type : 'category', //类目型
boundaryGap : false, //两端空白取消
data : ['周一','周二','周三','周四','周五','周六','周日']
}
],
yAxis : [
{
type : 'value',
axisLabel : {
formatter: '{value} 人'
}
}
],
series : [
{
name:'关注人数',
type:'line',
data:[18, 28, 15, 13, 12, 13, 21],
markPoint : {
data : [
{type : 'max', name: '最大值'},
{type : 'min', name: '最小值'}
]
},
markLine : {
data : [
{type : 'average', name: '平均值'}
]
}
}
]
};
// 为echarts对象加载数据
myChart.setOption(option);
}
);
</script>
</body>
![]()


 浙公网安备 33010602011771号