mpl绘制热图
mpl使用函数plt.imshow()将数据显示为图像,或者和PIL结合使用对图片进行处理。我们称之为Image plot,或者热图。
函数格式:
matplotlib.pyplot.imshow(X, cmap=None, norm=None, aspect=None, interpolation=None, alpha=None, vmin=None, vmax=None, origin=None, extent=None, *, filternorm=True, filterrad=4.0, resample=None, url=None, data=None, **kwargs)
作用:
将数据显示为图像,即在2D常规光栅上。
输入可以是实际的RGB(A)数据,也可以是2D标量数据,这些数据将被渲染为伪彩色图像。
为了显示灰度图像,使用参数cmap='gray', vmin=0, vmax=255设置颜色映射。
参数说明:
X:array-like or PIL image
图像数据。支持的数组形状有:
(M, N):含有标量数据的图像。使用标准化和颜色映射将值映射到颜色。参见参数norm, cmap, vmin, vmax。
(M, N, 3): RGB值(0-1 float or 0-255 int)的图像。
(M, N, 4):带有RGBA值(0-1 float or 0-255 int)的图像,即包含透明度。
前两个维度(M, N)定义图像的行和列。
超出范围的RGB(A)值被剪切。
cmap : str or `~matplotlib.colors.Colormap`, default: :rc:`image.cmap`(default: 'viridis')
Colormap实例的简写。用于控制渐变色。对于RGB(A)数据,此参数被忽略。
可选参数如下:
'Accent', 'Accent_r', 'Blues', 'Blues_r', 'BrBG', 'BrBG_r', 'BuGn', 'BuGn_r', 'BuPu', 'BuPu_r',
'CMRmap', 'CMRmap_r', 'Dark2', 'Dark2_r', 'GnBu', 'GnBu_r', 'Greens', 'Greens_r', 'Greys', 'Greys_r',
'OrRd', 'OrRd_r', 'Oranges', 'Oranges_r', 'PRGn', 'PRGn_r', 'Paired', 'Paired_r', 'Pastel1', 'Pastel1_r',
'Pastel2', 'Pastel2_r', 'PiYG', 'PiYG_r', 'PuBu', 'PuBuGn', 'PuBuGn_r', 'PuBu_r', 'PuOr', 'PuOr_r', 'PuRd',
'PuRd_r', 'Purples', 'Purples_r', 'RdBu', 'RdBu_r', 'RdGy', 'RdGy_r', 'RdPu', 'RdPu_r', 'RdYlBu', 'RdYlBu_r',
'RdYlGn', 'RdYlGn_r', 'Reds', 'Reds_r', 'Set1', 'Set1_r', 'Set2', 'Set2_r', 'Set3', 'Set3_r', 'Spectral', 'Spectral_r',
'Wistia', 'Wistia_r', 'YlGn', 'YlGnBu', 'YlGnBu_r', 'YlGn_r', 'YlOrBr', 'YlOrBr_r', 'YlOrRd', 'YlOrRd_r', 'afmhot',
'afmhot_r', 'autumn', 'autumn_r', 'binary', 'binary_r', 'bone', 'bone_r', 'brg', 'brg_r', 'bwr', 'bwr_r', 'cividis',
'cividis_r', 'cool', 'cool_r', 'coolwarm', 'coolwarm_r', 'copper', 'copper_r', 'cubehelix', 'cubehelix_r', 'flag',
'flag_r', 'gist_earth', 'gist_earth_r', 'gist_gray', 'gist_gray_r', 'gist_heat', 'gist_heat_r', 'gist_ncar', 'gist_ncar_r',
'gist_rainbow', 'gist_rainbow_r', 'gist_stern', 'gist_stern_r', 'gist_yarg', 'gist_yarg_r', 'gnuplot', 'gnuplot2',
'gnuplot2_r', 'gnuplot_r', 'gray', 'gray_r', 'hot', 'hot_r', 'hsv', 'hsv_r', 'inferno', 'inferno_r', 'jet', 'jet_r',
'magma', 'magma_r', 'nipy_spectral', 'nipy_spectral_r', 'ocean', 'ocean_r', 'pink', 'pink_r', 'plasma', 'plasma_r',
'prism', 'prism_r', 'rainbow', 'rainbow_r', 'seismic', 'seismic_r', 'spring', 'spring_r', 'summer', 'summer_r', 'tab10',
'tab10_r', 'tab20', 'tab20_r', 'tab20b', 'tab20b_r', 'tab20c', 'tab20c_r', 'terrain', 'terrain_r', 'turbo', 'turbo_r',
'twilight', 'twilight_r', 'twilight_shifted', 'twilight_shifted_r', 'viridis', 'viridis_r', 'winter', 'winter_r'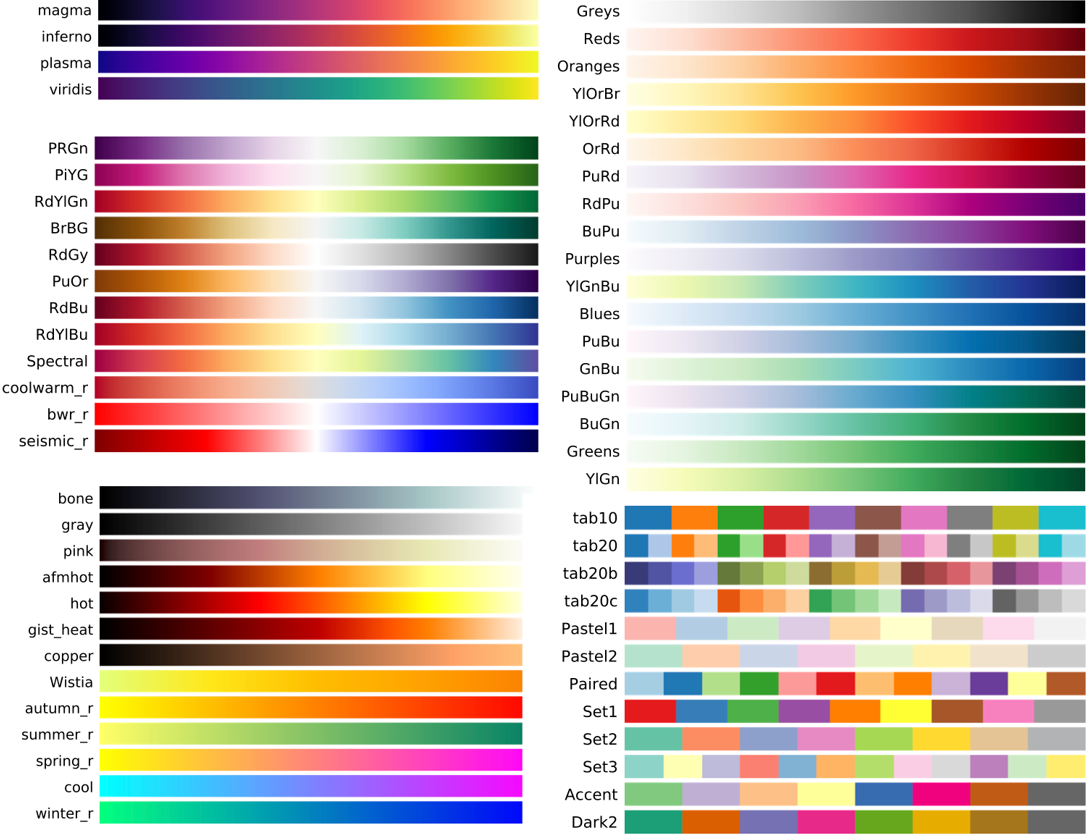
norm : `~matplotlib.colors.Normalize`, optional
Normalize实例用于在使用cmap映射到颜色之前将标量数据缩放到[0,1]范围。 默认情况下,使用线性缩放,将最低值映射为0,最高值映射为1。 对于RGB(A)数据,此参数被忽略。
aspect : {'equal', 'auto'} or float, default: :rc:`image.aspect`
轴的长宽比。 这个参数与图像特别相关,因为它决定了数据像素是否为正方形。 此参数是显式调用的快捷方式 。
- 'equal':确保长宽比为1。 像素将是正方形(除非使用*extent*在数据坐标中明确地使像素大小是非正方形)。
- 'auto':坐标轴是固定的,角度是调整的,以便数据适合坐标轴。 通常,这将导致非正方形像素。
alpha : float or array-like, optional
设置透明度。
vmin, vmax : float, optional
当使用标量数据且没有显式*norm*时,*vmin*和*vmax*定义了colormap覆盖的数据范围。 默认情况下,colormap覆盖供应数据的完整值范围。
也就是将标量数据缩放到限定数值的范围。
当给定了*norm*时,不建议使用*vmin*/*vmax*。
origin : {'upper', 'lower'}, default: "upper"
指定坐标轴的方向。“upper”:左上为(0,0);“lower”:左下为(0,0)。
extent : floats (left, right, bottom, top), optional
设定热图的横纵坐标极值。图像将填充的数据坐标中的边界框,并沿着x和y分别拉伸以填充方框。
如果我们不指定参数,那么它的默认数值遵循以下规则:
像素在数据坐标中占据一个单位。 它们的中心在整数坐标上,它们的中心坐标的范围是x:0到列-1,y:0到行-1。非常整齐。
如果我们指定了参数,就相当于是改变了刻度和比例。
另外,这个参数是和origin密切相关的。
- For ``origin == 'upper'`` the default is
``(-0.5, numcols-0.5, numrows-0.5, -0.5)``.
- For ``origin == 'lower'`` the default is
``(-0.5, numcols-0.5, -0.5, numrows-0.5)``.
请注意,这个参数的并不是设定子图,或者说坐标轴(axes)的长度。如果我们另外设置ax.set(),会达到一种图中图的效果。
interpolation : str, default: :rc:`image.interpolation`
指定插值方法。目前我还不理解这个参数的作用。可能是统计学相关。
        'none', 'antialiased', 'nearest', 'bilinear',
        'bicubic', 'spline16', 'spline36', 'hanning', 'hamming', 'hermite',
        'kaiser', 'quadric', 'catrom', 'gaussian', 'bessel', 'mitchell',
        'sinc', 'lanczos'.
点击查看代码
fig,ax=plt.subplots(1,2)
x=Image.open('0.png')
x1=np.array(x)
print(x.format,x.size,x.mode)

norm=mpl.colors.Normalize(vmin=-100,vmax=1000)
y=np.arange(30).reshape(5,6)
ax[0].imshow(x1,norm=norm,cmap="gray")

ax[1].imshow(y,origin="upper",cmap="winter",extent=(0,10,0,5))
ax[1].set(xlim=(0,10),ylim=(0,10))
plt.show()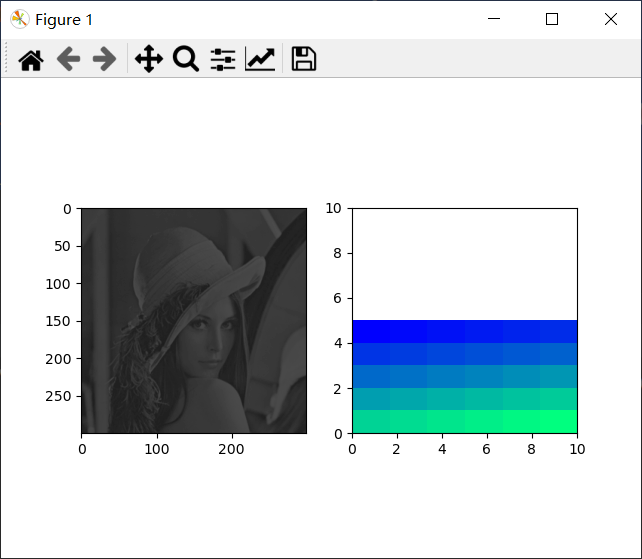

 浙公网安备 33010602011771号