mpl基础绘图之条形图
plt.bar()函数:
作用:绘制条形图。bar:条的意思。
函数格式:bar(x, height, width=0.8, bottom=None, *, align='center', data=None, **kwargs)
参数说明:
| 参数 | 类型 | 说明 |
| x | float or array-like | 竖条的横坐标。 |
| height | float or array-like | 竖条的高度,即纵坐标。 |
| width | float or array-like, default: 0.8 | 竖条的宽度。 |
| bottom | float or array-like, default: 0 | 纵坐标的基底。我们设置了bottom之后,height自然就成为增量了。在数据比较大的时候较为方便。 |
| align | {'center', 'edge'}, default: 'center' |
竖条底部与横坐标的对齐方式。 - 'center':底座在*x*位置居中。 - 'edge':将竖条的左边缘与*x*位置对齐。 |
x:float or array-like
竖条的横坐标。
height:float or array-like
竖条的高度。
width:float or array-like, default: 0.8
竖条的宽度。
bottom:float or array-like, default: 0
纵坐标的基底。
align:{'center', 'edge'}, default: 'center'
竖条底部与横坐标的对齐方式。
- 'center':底座在*x*位置居中。
- 'edge':将竖条的左边缘与*x*位置对齐。
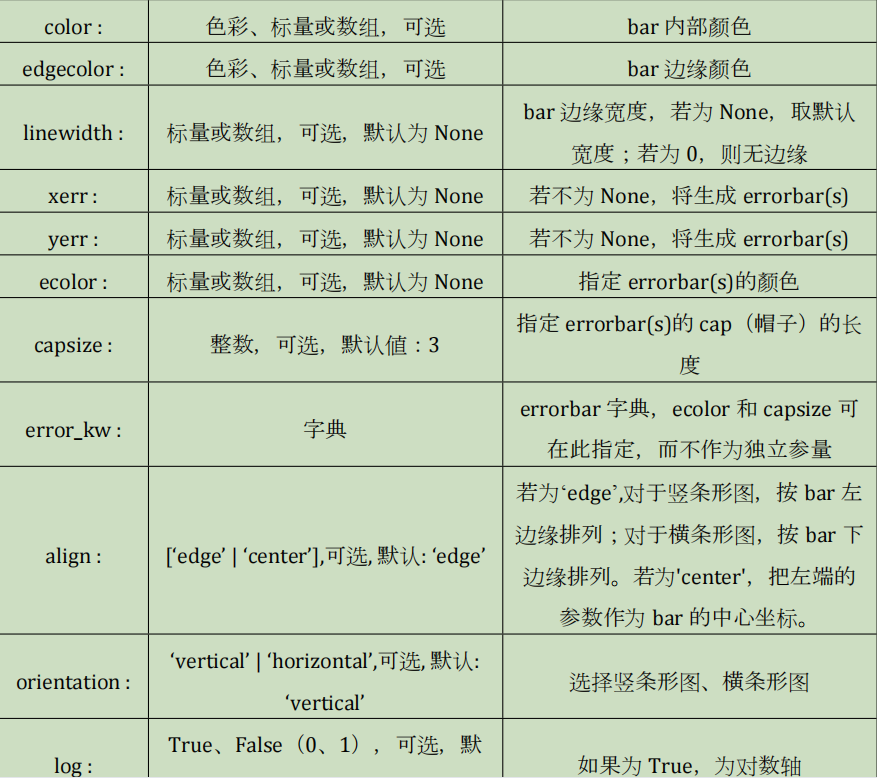
其他的参数:
点击查看代码
fig,ax=plt.subplots()
x2=np.arange(10)
y2=np.random.uniform(0,10,10)
plt.bar(x2,y2,width=0.8,
        bottom=50,
        color="#66ccff",
        )
plt.show()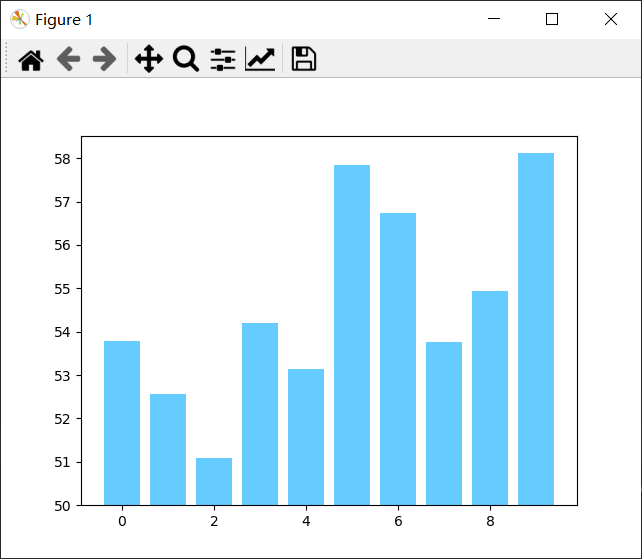

 浙公网安备 33010602011771号